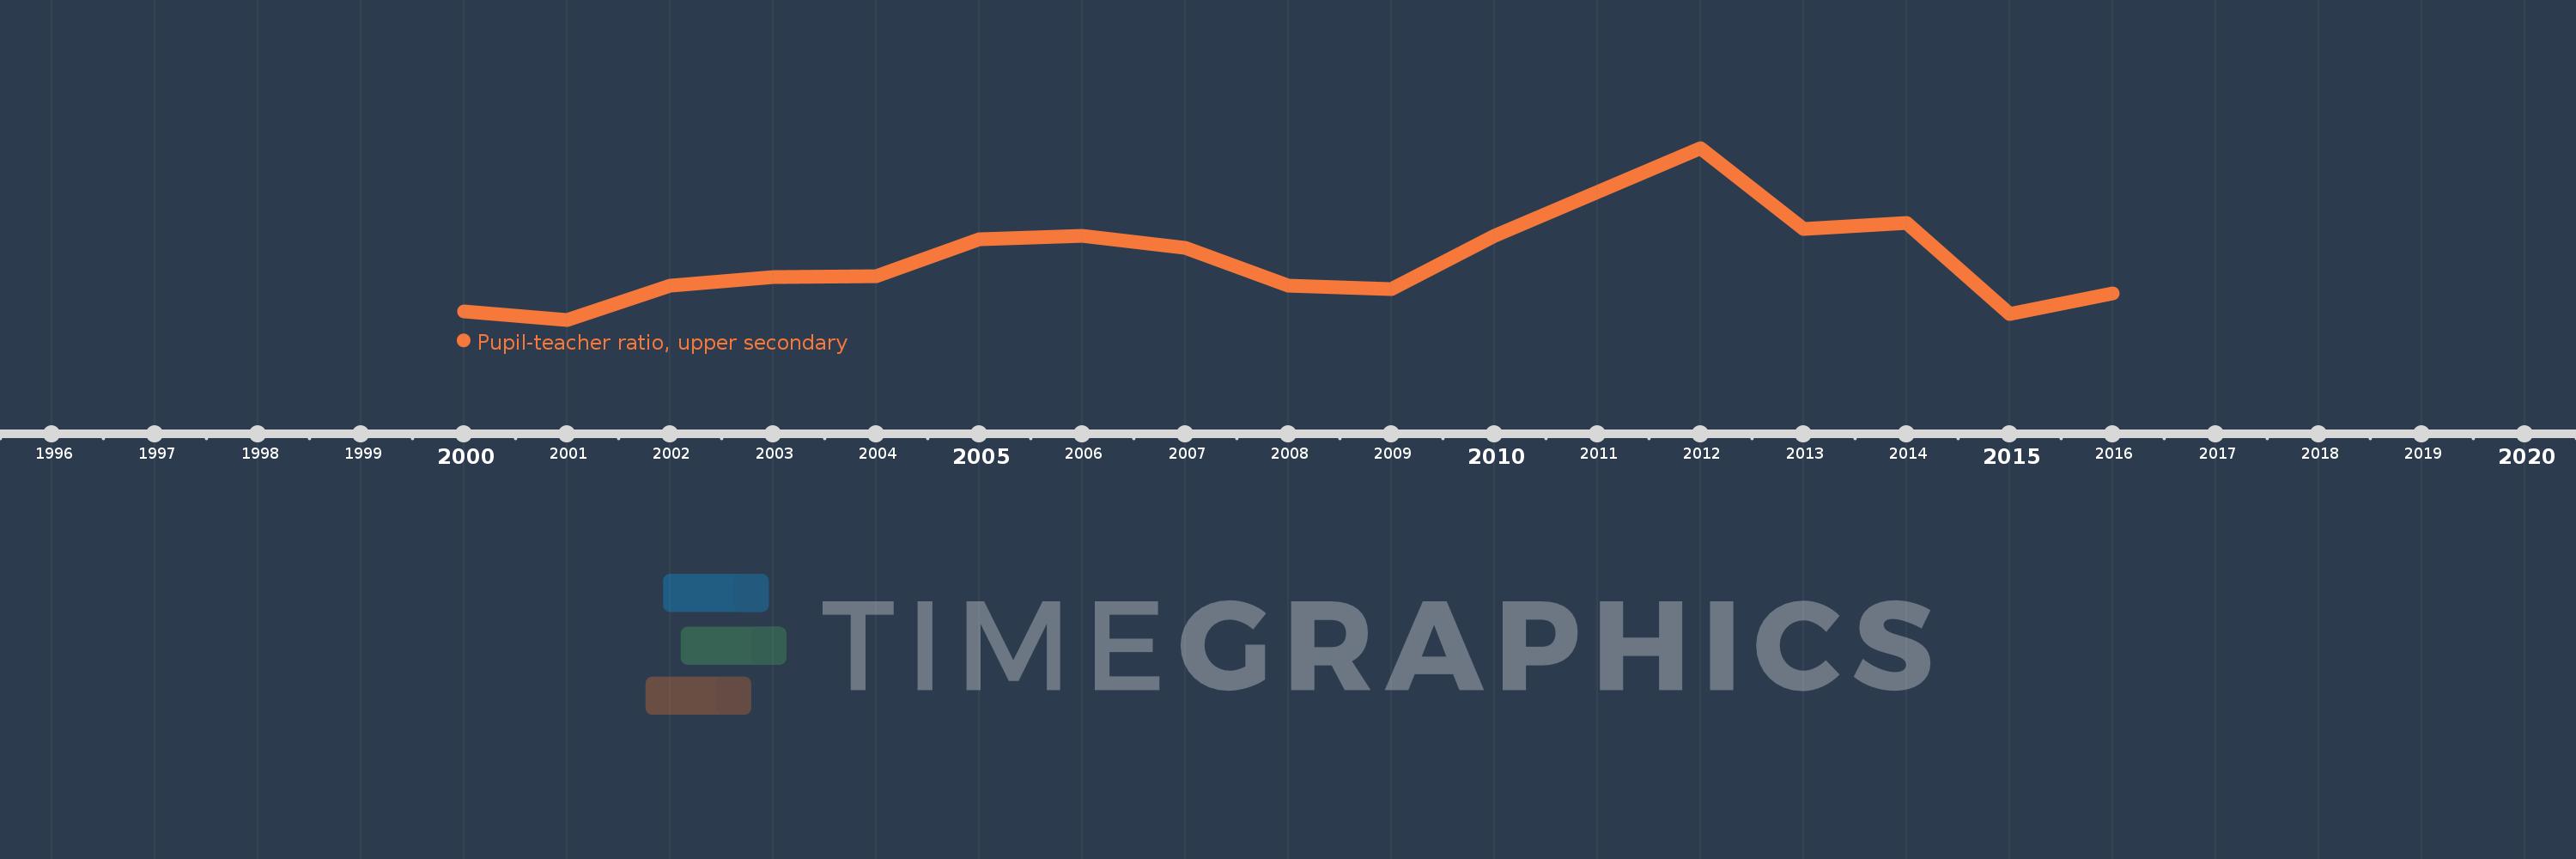
Questa scala temporale mostra un grafico dal 2000 anno al 2016 anno. Ghana. I dati fino ad 1999 anno non disponibili. Il numero di osservazioni attuali secondo i date: 16.
La fonte (nome):
Indicatori dello sviluppo mondiale
La fonte (organizzazione):
United Nations Educational, Scientific, and Cultural Organization (UNESCO) Institute for Statistics.
Categorie:
Education
sono stati aggiornati
23 apr 2017 anni
Indicatori delle variazioni dei valori per anni
In media:
20.685
Minima:
18.473
1 gen 2001 anni
Massimo:
25.197
1 gen 2012 anni
Alla data di osservazione
Valore
Variazione assoluta
La variazione rispetto al valore precedente
1 gen 2000 anni
18.793
+18.793
0.0%
1 gen 2001 anni
18.473
-0.32
-1.7%
1 gen 2002 anni
19.801
+1.328
7.19%
1 gen 2003 anni
20.146
+0.345
1.74%
1 gen 2004 anni
20.164
+0.018
0.09%
1 gen 2005 anni
21.621
+1.457
7.23%
1 gen 2006 anni
21.761
+0.14
0.65%
1 gen 2007 anni
21.287
-0.474
-2.18%
1 gen 2008 anni
19.794
-1.493
-7.01%
1 gen 2009 anni
19.658
-0.136
-0.68%
1 gen 2010 anni
21.766
+2.108
10.72%
1 gen 2012 anni
25.197
+3.431
15.76%
1 gen 2013 anni
22.041
-3.156
-12.52%
1 gen 2014 anni
22.246
+0.204
0.93%
1 gen 2015 anni
18.703
-3.542
-15.92%
1 gen 2016 anni
19.504
+0.801
4.28%
Classificazione dei paesi secondo i statistiche attuali per anni