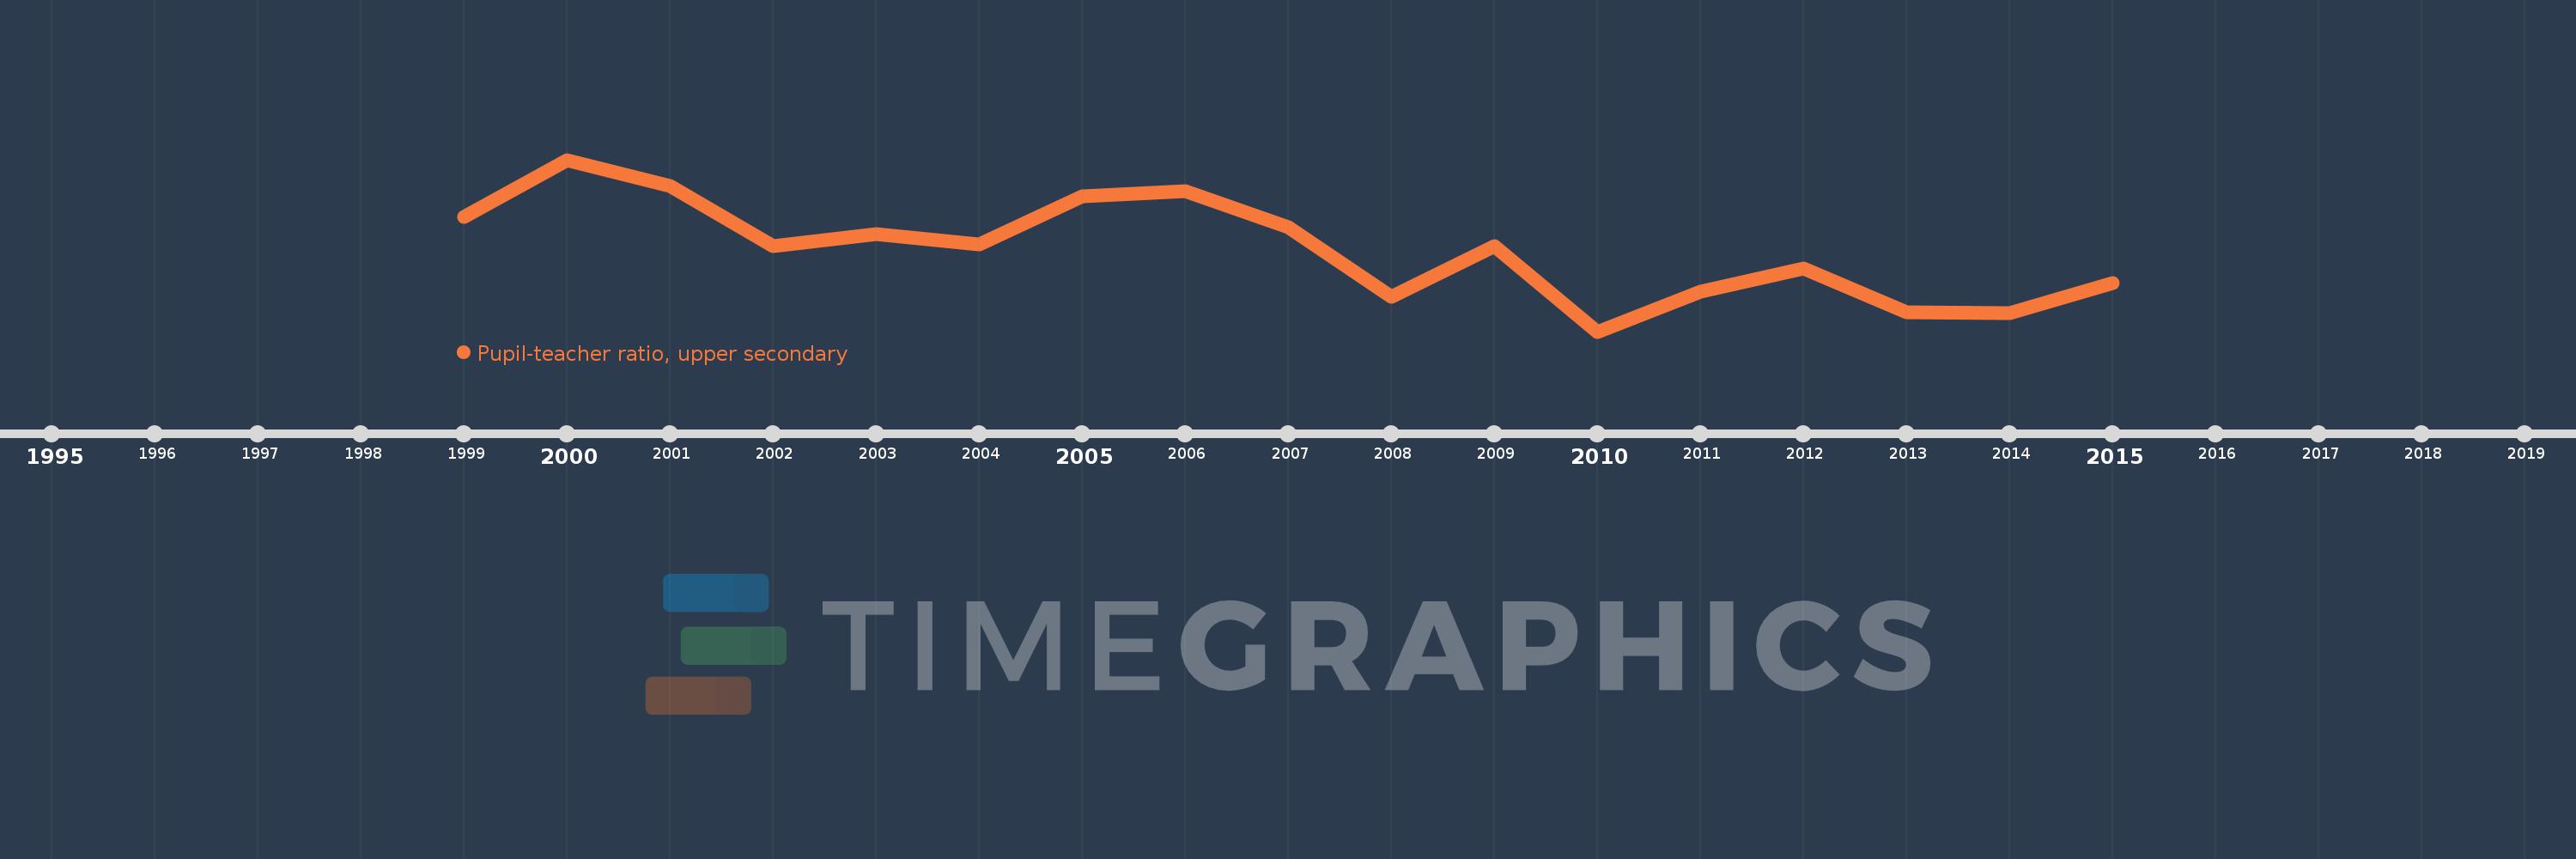
Questa scala temporale mostra un grafico dal 1999 anno al 2015 anno. Fragile and conflict affected situations. I dati fino ad 1998 anno non disponibili. Il numero di osservazioni attuali secondo i date: 17.
La fonte (nome):
Indicatori dello sviluppo mondiale
La fonte (organizzazione):
United Nations Educational, Scientific, and Cultural Organization (UNESCO) Institute for Statistics.
Categorie:
Education
sono stati aggiornati
23 apr 2017 anni
Indicatori delle variazioni dei valori per anni
In media:
16.883
Minima:
16.355
1 gen 2010 anni
Massimo:
17.462
1 gen 2000 anni
Alla data di osservazione
Valore
Variazione assoluta
La variazione rispetto al valore precedente
1 gen 1999 anni
17.096
+17.096
0.0%
1 gen 2000 anni
17.462
+0.365
2.14%
1 gen 2001 anni
17.294
-0.168
-0.96%
1 gen 2002 anni
16.907
-0.387
-2.24%
1 gen 2003 anni
16.984
+0.078
0.46%
1 gen 2004 anni
16.918
-0.067
-0.39%
1 gen 2005 anni
17.227
+0.31
1.83%
1 gen 2006 anni
17.259
+0.032
0.19%
1 gen 2007 anni
17.027
-0.233
-1.35%
1 gen 2008 anni
16.578
-0.449
-2.64%
1 gen 2009 anni
16.908
+0.331
1.99%
1 gen 2010 anni
16.355
-0.553
-3.27%
1 gen 2011 anni
16.61
+0.256
1.56%
1 gen 2012 anni
16.763
+0.153
0.92%
1 gen 2013 anni
16.479
-0.284
-1.7%
1 gen 2014 anni
16.476
-0.003
-0.02%
1 gen 2015 anni
16.67
+0.193
1.17%
Classificazione dei paesi secondo i statistiche attuali per anni