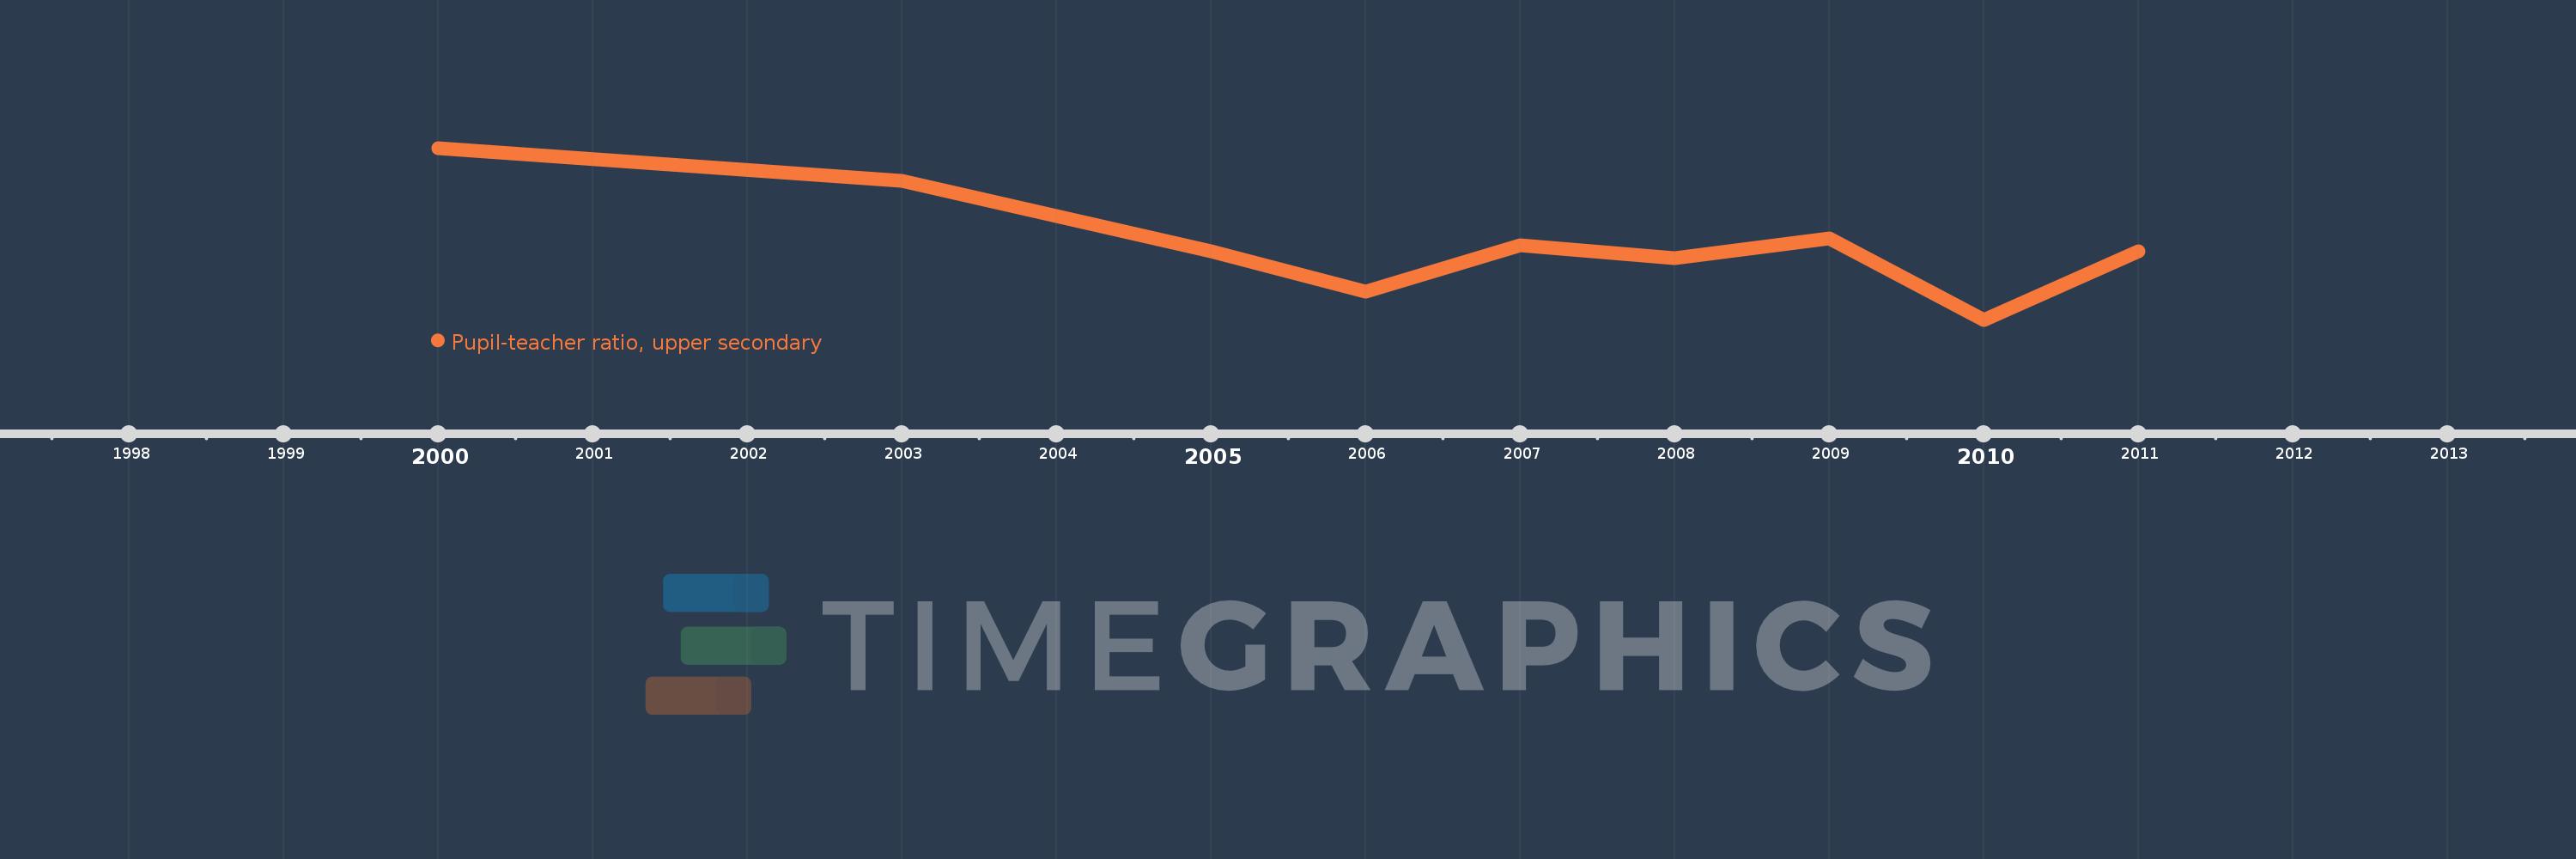
Questa scala temporale mostra un grafico dal 2000 anno al 2011 anno. Bahamas, The. I dati fino ad 1999 anno non disponibili. Il numero di osservazioni attuali secondo i date: 9.
La fonte (nome):
Indicatori dello sviluppo mondiale
La fonte (organizzazione):
United Nations Educational, Scientific, and Cultural Organization (UNESCO) Institute for Statistics.
Categorie:
Education
sono stati aggiornati
23 apr 2017 anni
Indicatori delle variazioni dei valori per anni
In media:
12.516
Minima:
10.021
1 gen 2010 anni
Massimo:
15.591
1 gen 2000 anni
Alla data di osservazione
Valore
Variazione assoluta
La variazione rispetto al valore precedente
1 gen 2000 anni
15.591
+15.591
0.0%
1 gen 2003 anni
14.521
-1.07
-6.86%
1 gen 2005 anni
12.228
-2.292
-15.79%
1 gen 2006 anni
10.918
-1.31
-10.71%
1 gen 2007 anni
12.44
+1.521
13.93%
1 gen 2008 anni
12.011
-0.428
-3.44%
1 gen 2009 anni
12.663
+0.651
5.42%
1 gen 2010 anni
10.021
-2.642
-20.87%
1 gen 2011 anni
12.249
+2.229
22.24%
Classificazione dei paesi secondo i statistiche attuali per anni