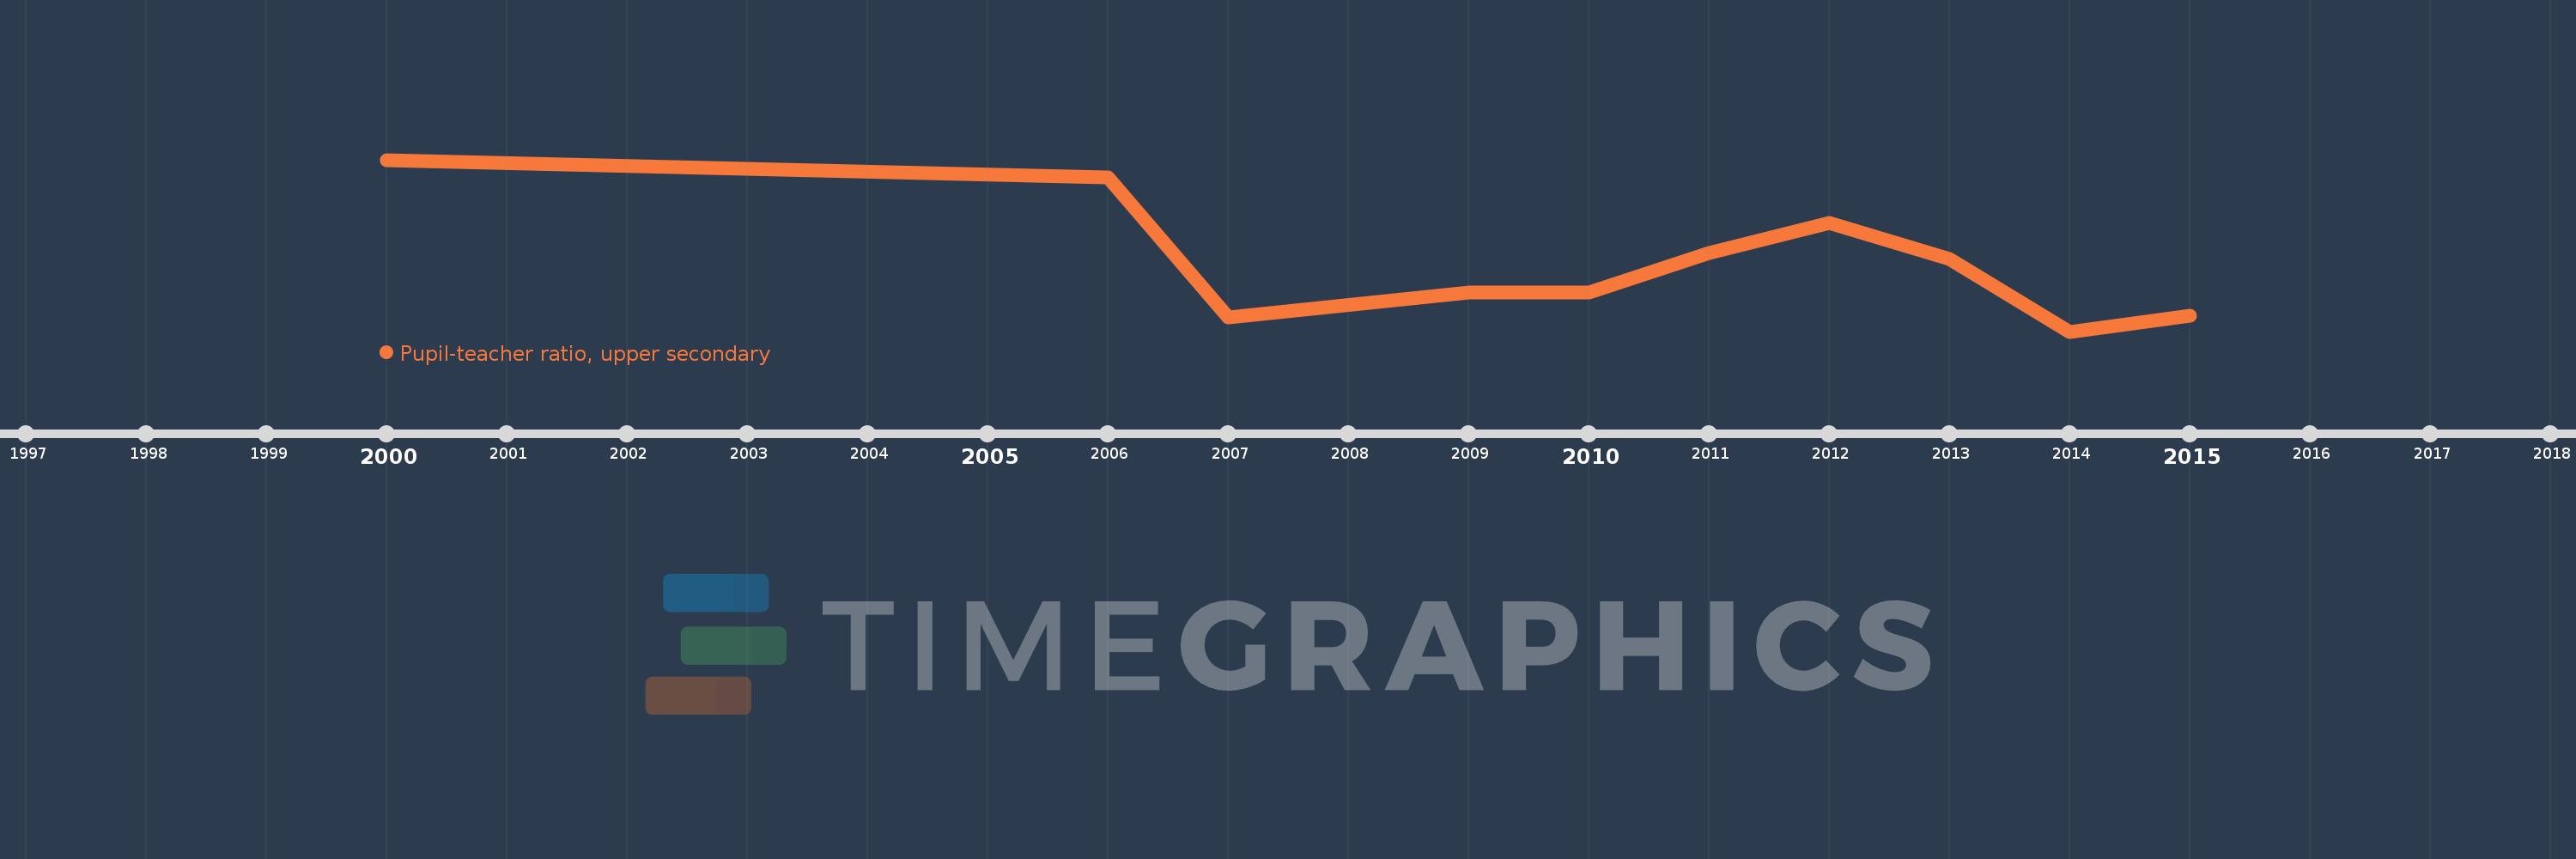
Questa scala temporale mostra un grafico dal 2000 anno al 2015 anno. Bhutan. I dati fino ad 1999 anno non disponibili. Il numero di osservazioni attuali secondo i date: 10.
La fonte (nome):
Indicatori dello sviluppo mondiale
La fonte (organizzazione):
United Nations Educational, Scientific, and Cultural Organization (UNESCO) Institute for Statistics.
Categorie:
Education
sono stati aggiornati
23 apr 2017 anni
Indicatori delle variazioni dei valori per anni
In media:
14.014
Minima:
9.505
1 gen 2014 anni
Massimo:
20.657
1 gen 2000 anni
Alla data di osservazione
Valore
Variazione assoluta
La variazione rispetto al valore precedente
1 gen 2000 anni
20.657
+20.657
0.0%
1 gen 2006 anni
19.516
-1.14
-5.52%
1 gen 2007 anni
10.423
-9.093
-46.59%
1 gen 2009 anni
12.034
+1.611
15.46%
1 gen 2010 anni
12.038
+0.003
0.03%
1 gen 2011 anni
14.599
+2.561
21.28%
1 gen 2012 anni
16.576
+1.977
13.54%
1 gen 2013 anni
14.233
-2.342
-14.13%
1 gen 2014 anni
9.505
-4.728
-33.22%
1 gen 2015 anni
10.558
+1.052
11.07%
Classificazione dei paesi secondo i statistiche attuali per anni