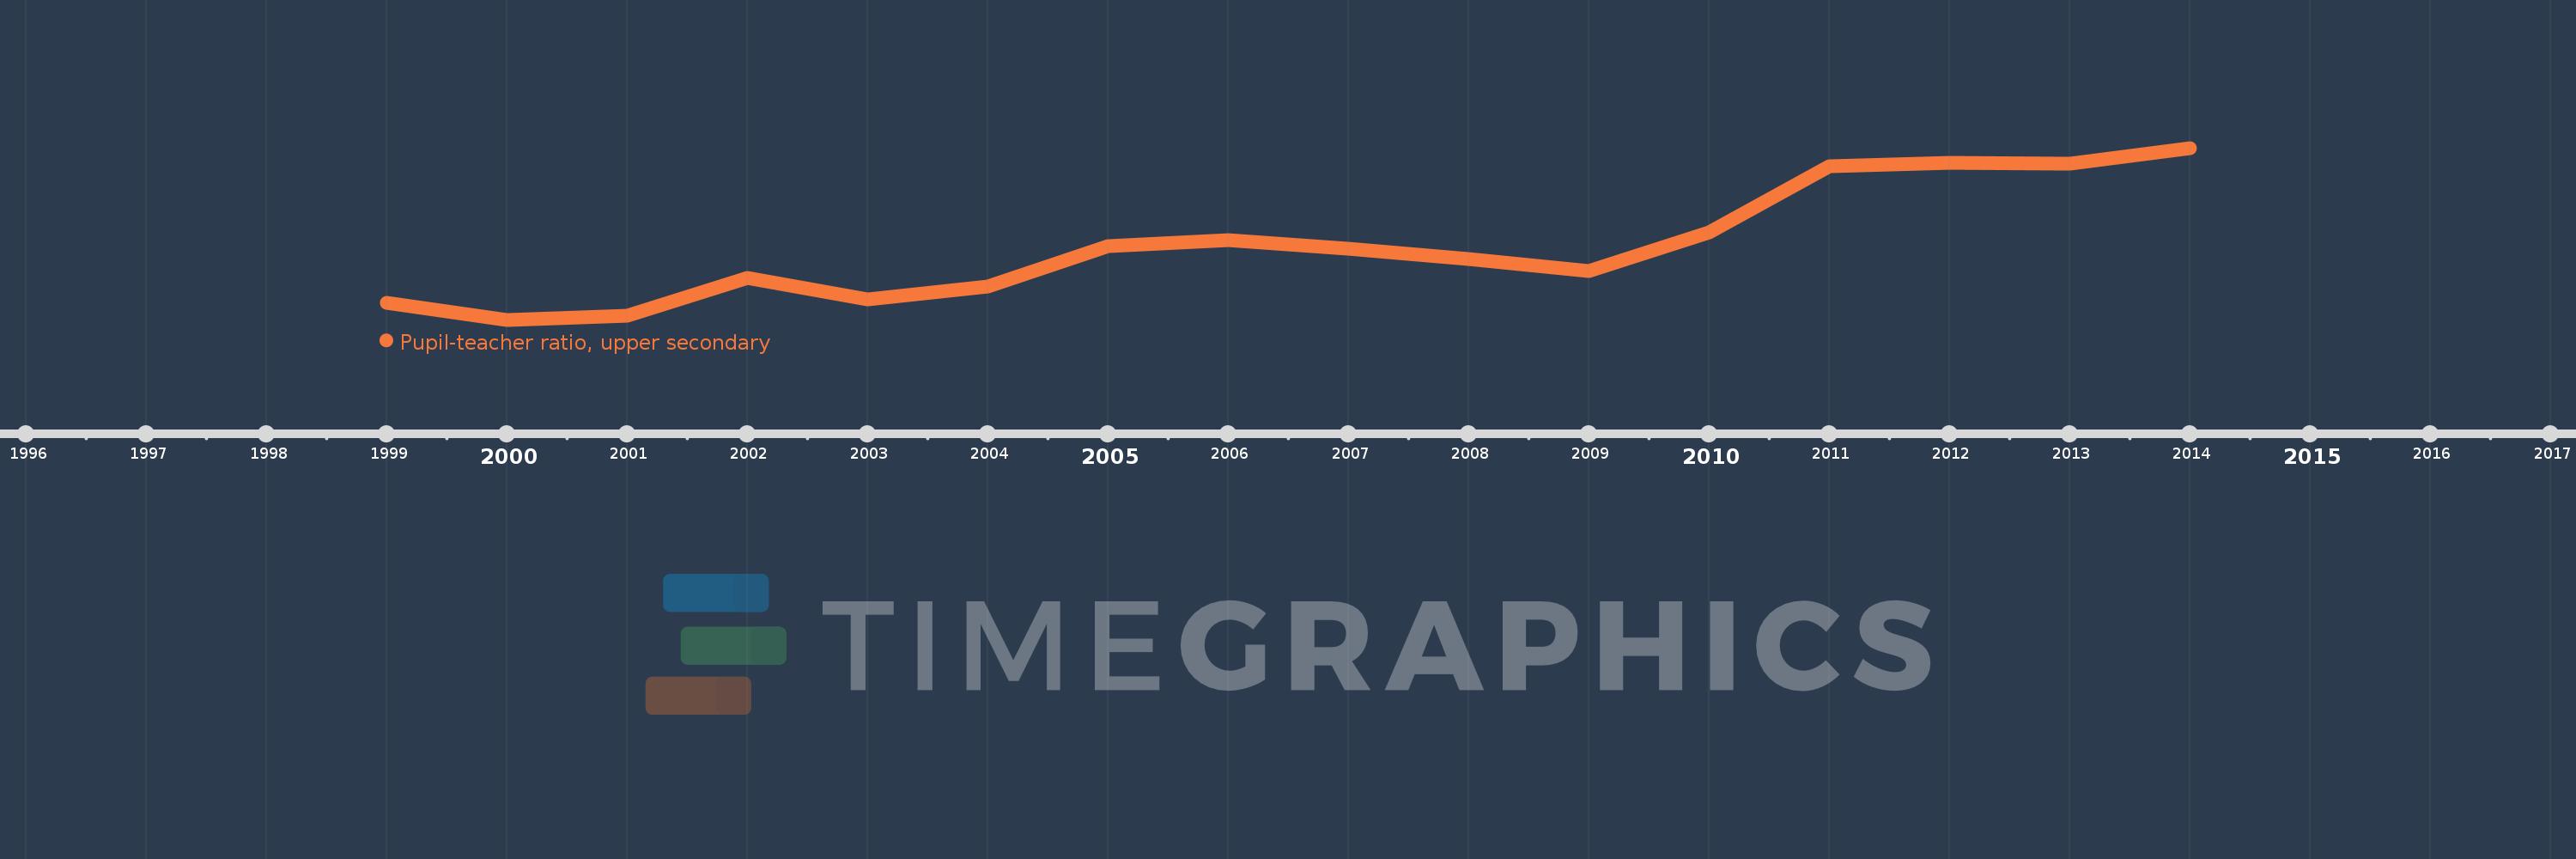
Questa scala temporale mostra un grafico dal 1999 anno al 2014 anno. IDA blend. I dati fino ad 1998 anno non disponibili. Il numero di osservazioni attuali secondo i date: 16.
La fonte (nome):
Indicatori dello sviluppo mondiale
La fonte (organizzazione):
United Nations Educational, Scientific, and Cultural Organization (UNESCO) Institute for Statistics.
Categorie:
Education
sono stati aggiornati
23 apr 2017 anni
Indicatori delle variazioni dei valori per anni
In media:
22.273
Minima:
18.857
1 gen 2000 anni
Massimo:
26.839
1 gen 2014 anni
Alla data di osservazione
Valore
Variazione assoluta
La variazione rispetto al valore precedente
1 gen 1999 anni
19.63
+19.63
0.0%
1 gen 2000 anni
18.857
-0.774
-3.94%
1 gen 2001 anni
19.037
+0.181
0.96%
1 gen 2002 anni
20.797
+1.76
9.24%
1 gen 2003 anni
19.807
-0.99
-4.76%
1 gen 2004 anni
20.415
+0.608
3.07%
1 gen 2005 anni
22.293
+1.878
9.2%
1 gen 2006 anni
22.545
+0.252
1.13%
1 gen 2007 anni
22.176
-0.369
-1.64%
1 gen 2008 anni
21.687
-0.489
-2.2%
1 gen 2009 anni
21.133
-0.554
-2.55%
1 gen 2010 anni
22.921
+1.787
8.46%
1 gen 2011 anni
25.973
+3.053
13.32%
1 gen 2012 anni
26.143
+0.169
0.65%
1 gen 2013 anni
26.114
-0.028
-0.11%
1 gen 2014 anni
26.839
+0.724
2.77%
Classificazione dei paesi secondo i statistiche attuali per anni