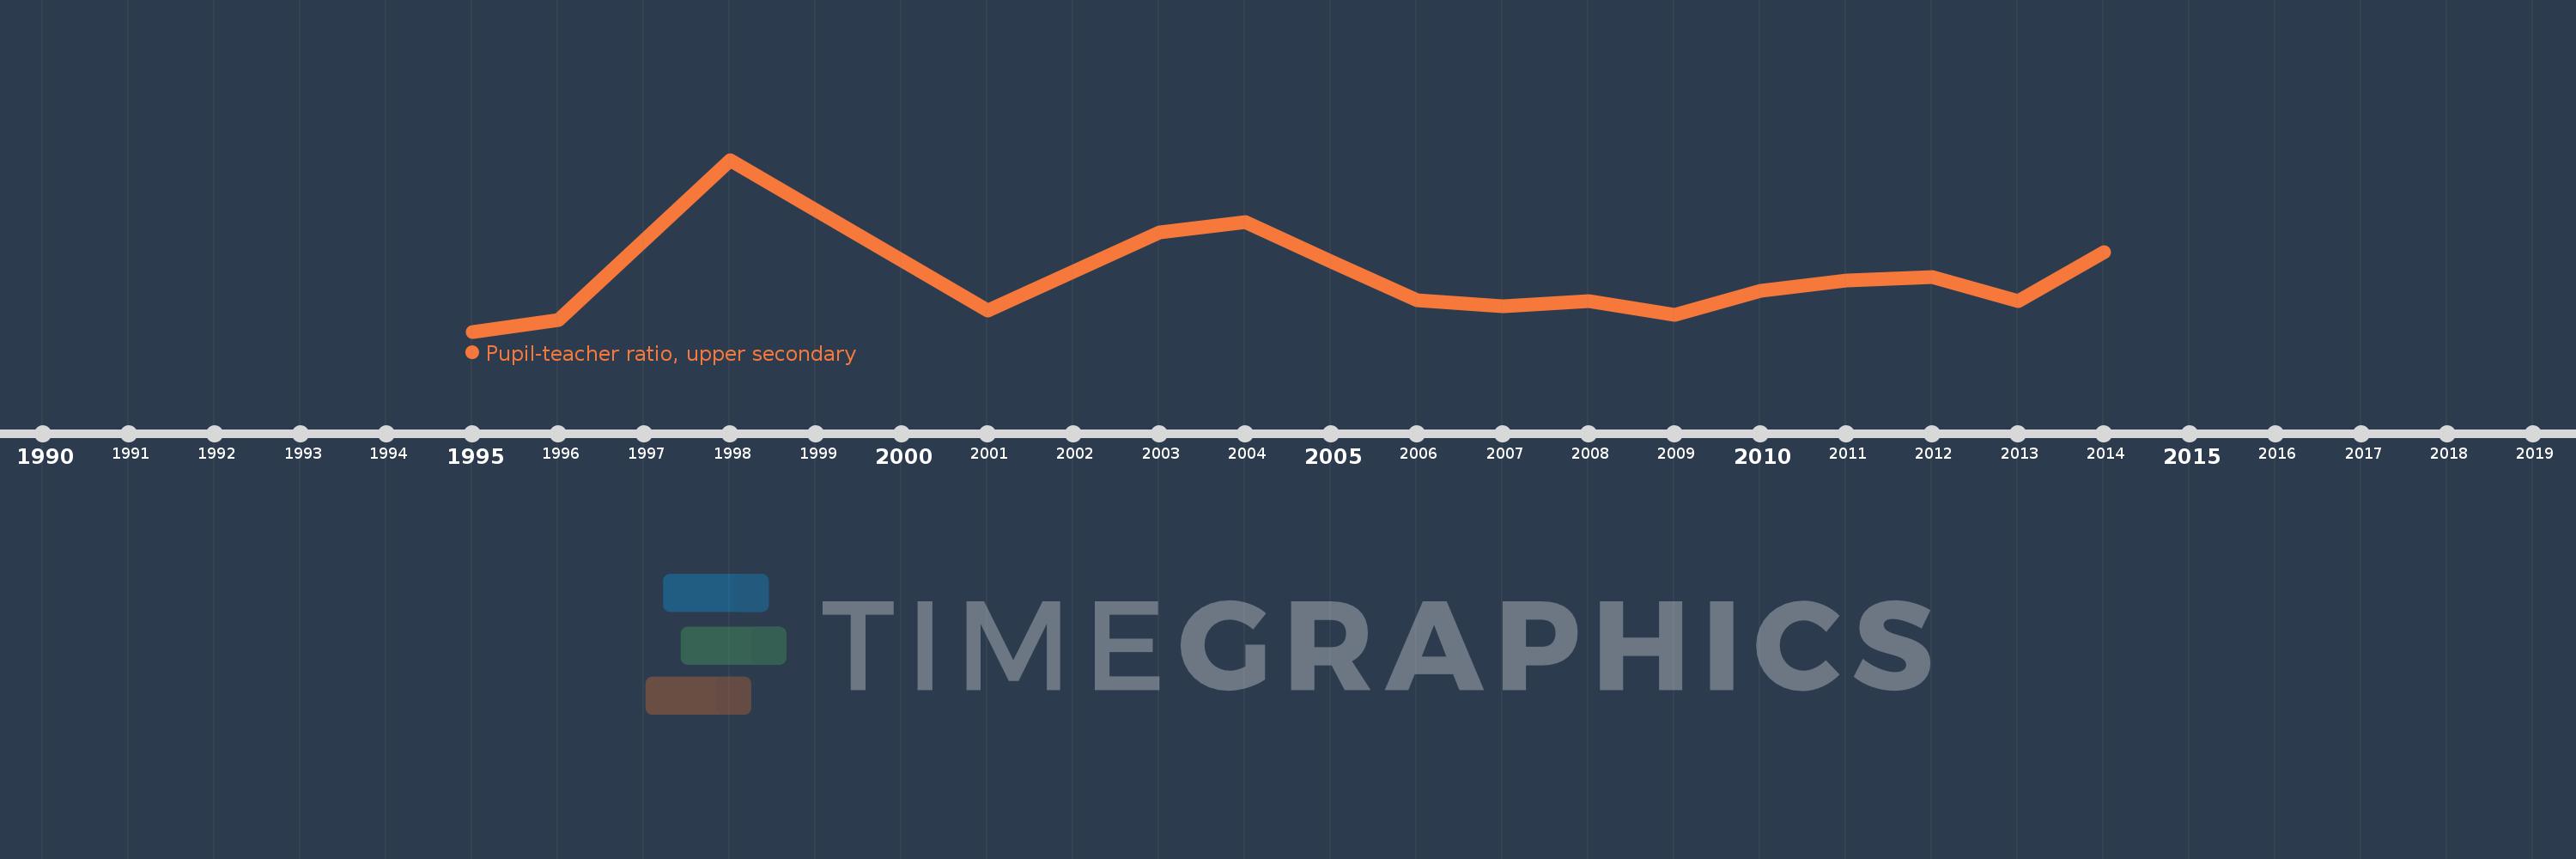
Questa scala temporale mostra un grafico dal 1995 anno al 2014 anno. Turkey. I dati fino ad 1994 anno non disponibili. Il numero di osservazioni attuali secondo i date: 16.
La fonte (nome):
Indicatori dello sviluppo mondiale
La fonte (organizzazione):
United Nations Educational, Scientific, and Cultural Organization (UNESCO) Institute for Statistics.
Categorie:
Education
sono stati aggiornati
23 apr 2017 anni
Indicatori delle variazioni dei valori per anni
In media:
17.727
Minima:
14.078
1 gen 1995 anni
Massimo:
25.971
1 gen 1998 anni
Alla data di osservazione
Valore
Variazione assoluta
La variazione rispetto al valore precedente
1 gen 1995 anni
14.078
+14.078
0.0%
1 gen 1996 anni
14.888
+0.81
5.75%
1 gen 1998 anni
25.971
+11.083
74.44%
1 gen 2001 anni
15.556
-10.415
-40.1%
1 gen 2003 anni
20.952
+5.396
34.69%
1 gen 2004 anni
21.681
+0.729
3.48%
1 gen 2005 anni
18.949
-2.732
-12.6%
1 gen 2006 anni
16.223
-2.726
-14.39%
1 gen 2007 anni
15.808
-0.416
-2.56%
1 gen 2008 anni
16.161
+0.353
2.23%
1 gen 2009 anni
15.238
-0.922
-5.71%
1 gen 2010 anni
16.924
+1.685
11.06%
1 gen 2011 anni
17.592
+0.668
3.95%
1 gen 2012 anni
17.828
+0.236
1.34%
1 gen 2013 anni
16.182
-1.646
-9.23%
1 gen 2014 anni
19.599
+3.416
21.11%
Classificazione dei paesi secondo i statistiche attuali per anni