29
/
en
AIzaSyAYiBZKx7MnpbEhh9jyipgxe19OcubqV5w
April 1, 2024
94966
Burkina Faso
BFA
true
2
1
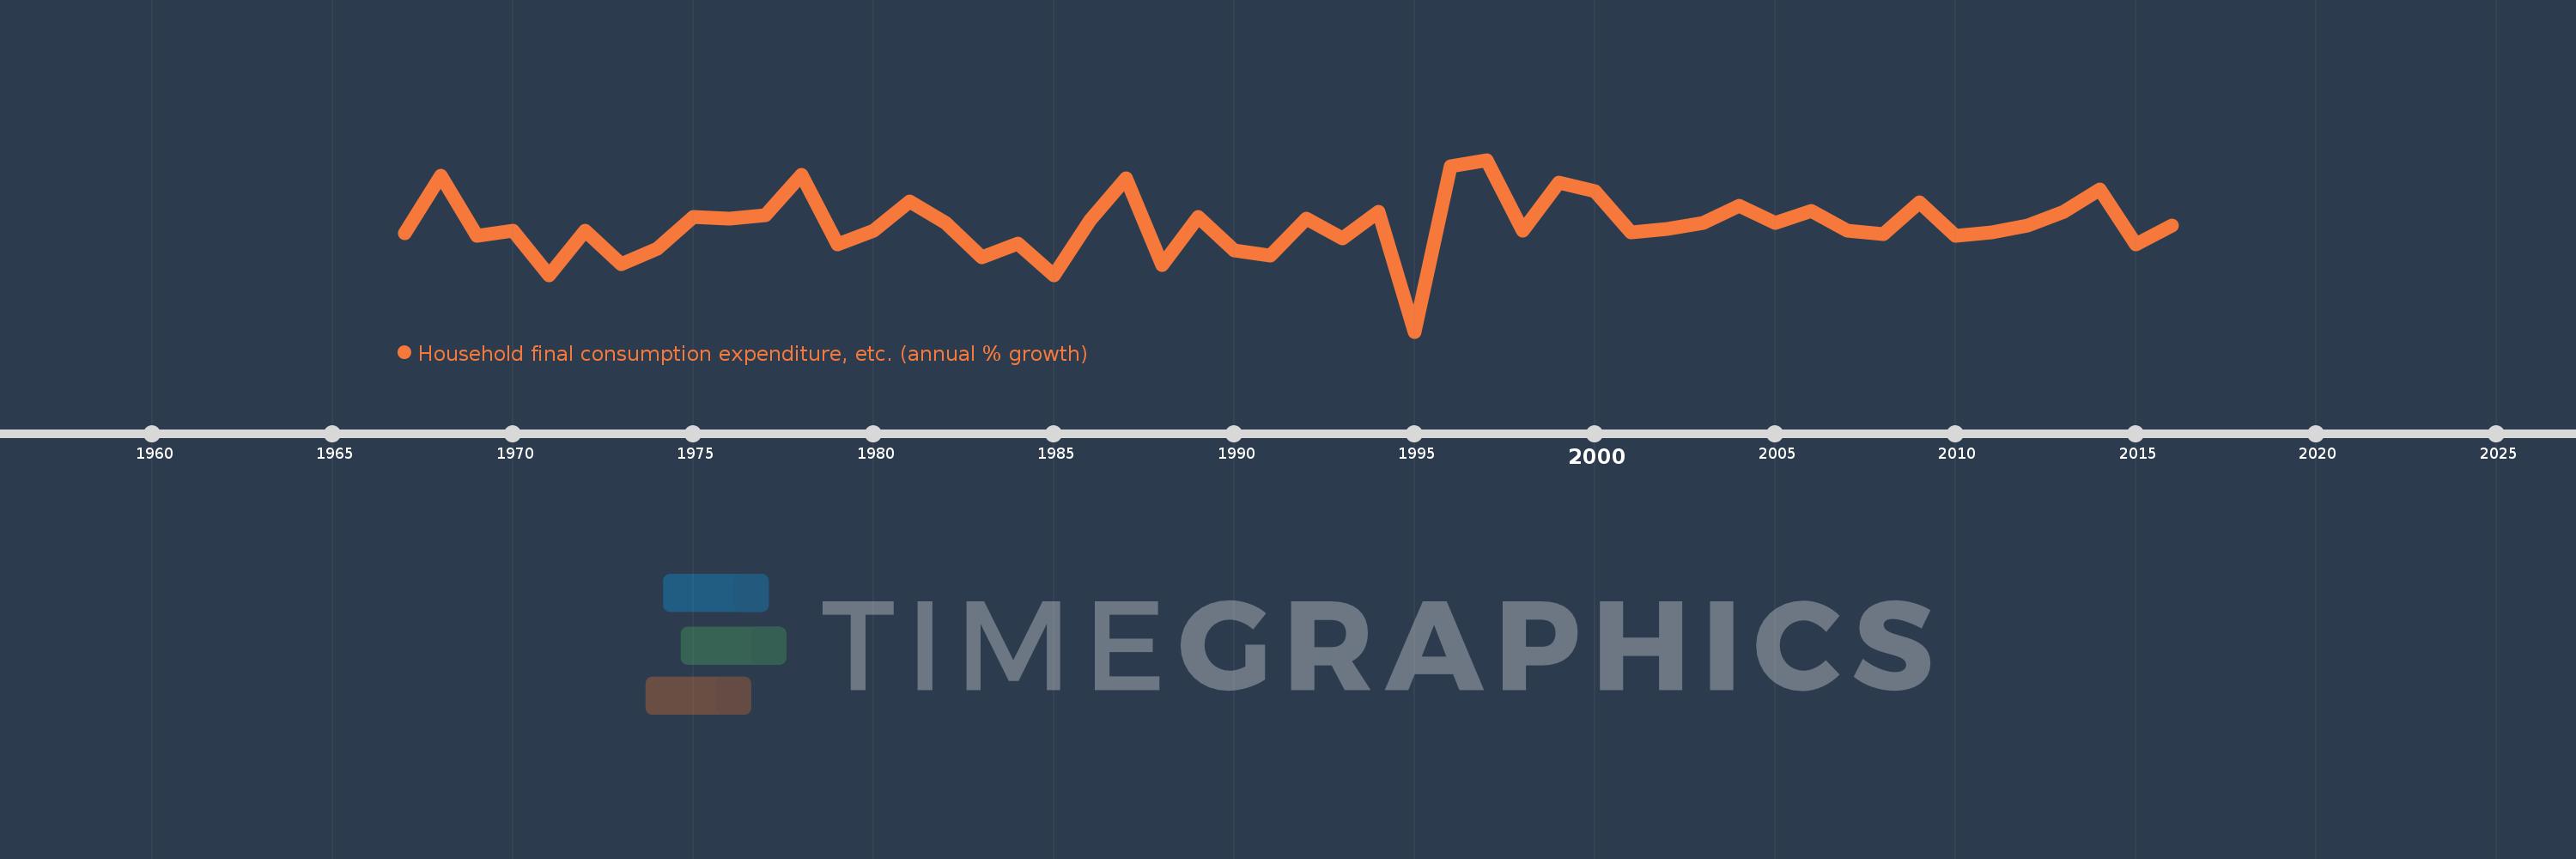
Household final consumption expenditure, etc. (annual % growth)
2016,2015,2014,2013,2012,2011,2010,2009,2008,2007,2006,2005,2004,2003,2002,2001,2000,1999,1998,1997,1996,1995,1994,1993,1992,1991,1990,1989,1988,1987,1986,1985,1984,1983,1982,1981,1980,1979,1978,1977,1976,1975,1974,1973,1972,1971,1970,1969,1968,1967
This statistics in other country:
AlbaniaAlgeriaAntigua and BarbudaArab WorldArgentinaArmeniaAustraliaAustriaAzerbaijanBahamas, TheBahrainBangladeshBarbadosBelarusBelgiumBelizeBeninBhutanBoliviaBosnia and HerzegovinaBotswanaBrazilBrunei DarussalamBulgariaBurkina FasoBurundiCabo VerdeCambodiaCameroonCanadaCaribbean small statesCentral Europe and the BalticsChadChileColombiaComorosCongo, Dem. Rep.Congo, Rep.Costa RicaCote d'IvoireCroatiaCubaCyprusCzech RepublicDenmarkDjiboutiDominican RepublicEarly-demographic dividendEast Asia & PacificEcuadorEgypt, Arab Rep.El SalvadorEquatorial GuineaEritreaEstoniaEthiopiaEuro areaEurope & Central AsiaEurope & Central Asia (excluding high income)Europe & Central Asia (IDA & IBRD countries)European UnionFijiFinlandFranceGabonGambia, TheGeorgiaGermanyGhanaGreeceGuatemalaGuineaGuinea-BissauHaitiHeavily indebted poor countries (HIPC)High incomeHondurasHong Kong SAR, ChinaHungaryIBRD onlyIcelandIDA & IBRD totalIDA blendIDA onlyIDA totalIndiaIndonesiaIran, Islamic Rep.IrelandIsraelItalyJamaicaJapanJordanKazakhstanKenyaKorea, Rep.KosovoKuwaitKyrgyz RepublicLao PDRLatin America & Caribbean Latin America & Caribbean (excluding high income)Latin America & the Caribbean (IDA & IBRD countries)LatviaLeast developed countries: UN classificationLebanonLiberiaLithuaniaLow & middle incomeLow incomeLower middle incomeLuxembourgMacao SAR, ChinaMacedonia, FYRMadagascarMalawiMalaysiaMaliMaltaMarshall IslandsMauritaniaMauritiusMexicoMiddle East & North AfricaMiddle East & North Africa (excluding high income)Middle East & North Africa (IDA & IBRD countries)Middle incomeMoldovaMongoliaMontenegroMoroccoMozambiqueNamibiaNepalNetherlandsNew ZealandNicaraguaNigerNigeriaNorth AmericaNorwayOECD membersOmanOther small statesPakistanPanamaPapua New GuineaParaguayPeruPhilippinesPolandPortugalPost-demographic dividendPre-demographic dividendPuerto RicoQatarRomaniaRussian FederationRwandaSaudi ArabiaSenegalSerbiaSeychellesSierra LeoneSingaporeSlovak RepublicSloveniaSmall statesSomaliaSouth AfricaSouth AsiaSouth Asia (IDA & IBRD)South SudanSpainSri LankaSub-Saharan Africa Sub-Saharan Africa (excluding high income)Sub-Saharan Africa (IDA & IBRD countries)SudanSurinameSwazilandSwedenSwitzerlandSyrian Arab RepublicTajikistanTanzaniaThailandTimor-LesteTogoTrinidad and TobagoTunisiaTurkeyTurkmenistanUgandaUkraineUnited Arab EmiratesUnited KingdomUnited StatesUpper middle incomeUruguayVanuatuVenezuela, RBVietnamWest Bank and GazaWorldZambiaZimbabwe Timeline:
This timeline shows a graph from 1967 to 2016 of Burkina Faso. No data until 1966. Number of actual observations by date: 50.
Source name:
World Development Indicators
Source organization:
World Bank national accounts data, and OECD National Accounts data files.
Categories, topics:
Economy & Growth
Last updated:
apr 23, 2017
Indicators value changes by year
Minimum:
-20.022
jan 1, 1995
At the date of observation
Value
Absolute change
Change from previous value
jan 1, 1967
1.873
+1.873
0.0%
jan 1, 1968
14.785
+12.913
689.58%
jan 1, 1969
1.276
-13.509
-91.37%
jan 1, 1970
2.434
+1.157
90.69%
jan 1, 1971
-7.464
-9.898
-406.72%
jan 1, 1972
2.537
+10.001
-133.99%
jan 1, 1973
-5.046
-7.582
-298.91%
jan 1, 1974
-1.608
+3.438
-68.14%
jan 1, 1975
5.614
+7.222
-449.21%
jan 1, 1976
5.171
-0.443
-7.89%
jan 1, 1977
5.931
+0.759
14.68%
jan 1, 1978
15.035
+9.104
153.51%
jan 1, 1979
-0.519
-15.554
-103.45%
jan 1, 1980
2.603
+3.122
-601.27%
jan 1, 1981
9.082
+6.479
248.94%
jan 1, 1982
4.215
-4.867
-53.59%
jan 1, 1983
-3.482
-7.697
-182.6%
jan 1, 1984
-0.433
+3.049
-87.56%
jan 1, 1985
-7.487
-7.054
1.63K%
jan 1, 1986
4.734
+12.221
-163.23%
jan 1, 1987
14.133
+9.399
198.53%
jan 1, 1988
-5.158
-19.291
-136.49%
jan 1, 1989
5.62
+10.778
-208.96%
jan 1, 1990
-1.838
-7.458
-132.7%
jan 1, 1991
-2.974
-1.136
61.84%
jan 1, 1992
5.265
+8.239
-277.01%
jan 1, 1993
0.711
-4.554
-86.5%
jan 1, 1994
6.656
+5.945
836.56%
jan 1, 1995
-20.022
-26.678
-400.81%
jan 1, 1996
16.947
+36.969
-184.64%
jan 1, 1997
18.34
+1.393
8.22%
jan 1, 1998
2.449
-15.891
-86.65%
jan 1, 1999
13.24
+10.791
440.68%
jan 1, 2000
11.307
-1.933
-14.6%
jan 1, 2001
2.143
-9.164
-81.05%
jan 1, 2002
2.876
+0.732
34.18%
jan 1, 2003
4.29
+1.415
49.19%
jan 1, 2004
8.122
+3.831
89.31%
jan 1, 2005
4.284
-3.837
-47.25%
jan 1, 2006
6.898
+2.614
61.01%
jan 1, 2007
2.603
-4.295
-62.27%
jan 1, 2008
1.655
-0.948
-36.42%
jan 1, 2009
8.872
+7.217
436.08%
jan 1, 2010
1.422
-7.45
-83.98%
jan 1, 2011
2.089
+0.667
46.92%
jan 1, 2012
3.61
+1.522
72.85%
jan 1, 2013
6.652
+3.041
84.25%
jan 1, 2014
11.685
+5.033
75.66%
jan 1, 2015
-0.534
-12.219
-104.57%
jan 1, 2016
3.63
+4.164
-779.86%
Ranking of countries by current statistics by years


Comments: