29
/
en
AIzaSyAYiBZKx7MnpbEhh9jyipgxe19OcubqV5w
April 1, 2024
223664
Philippines
PHL
true
2
1
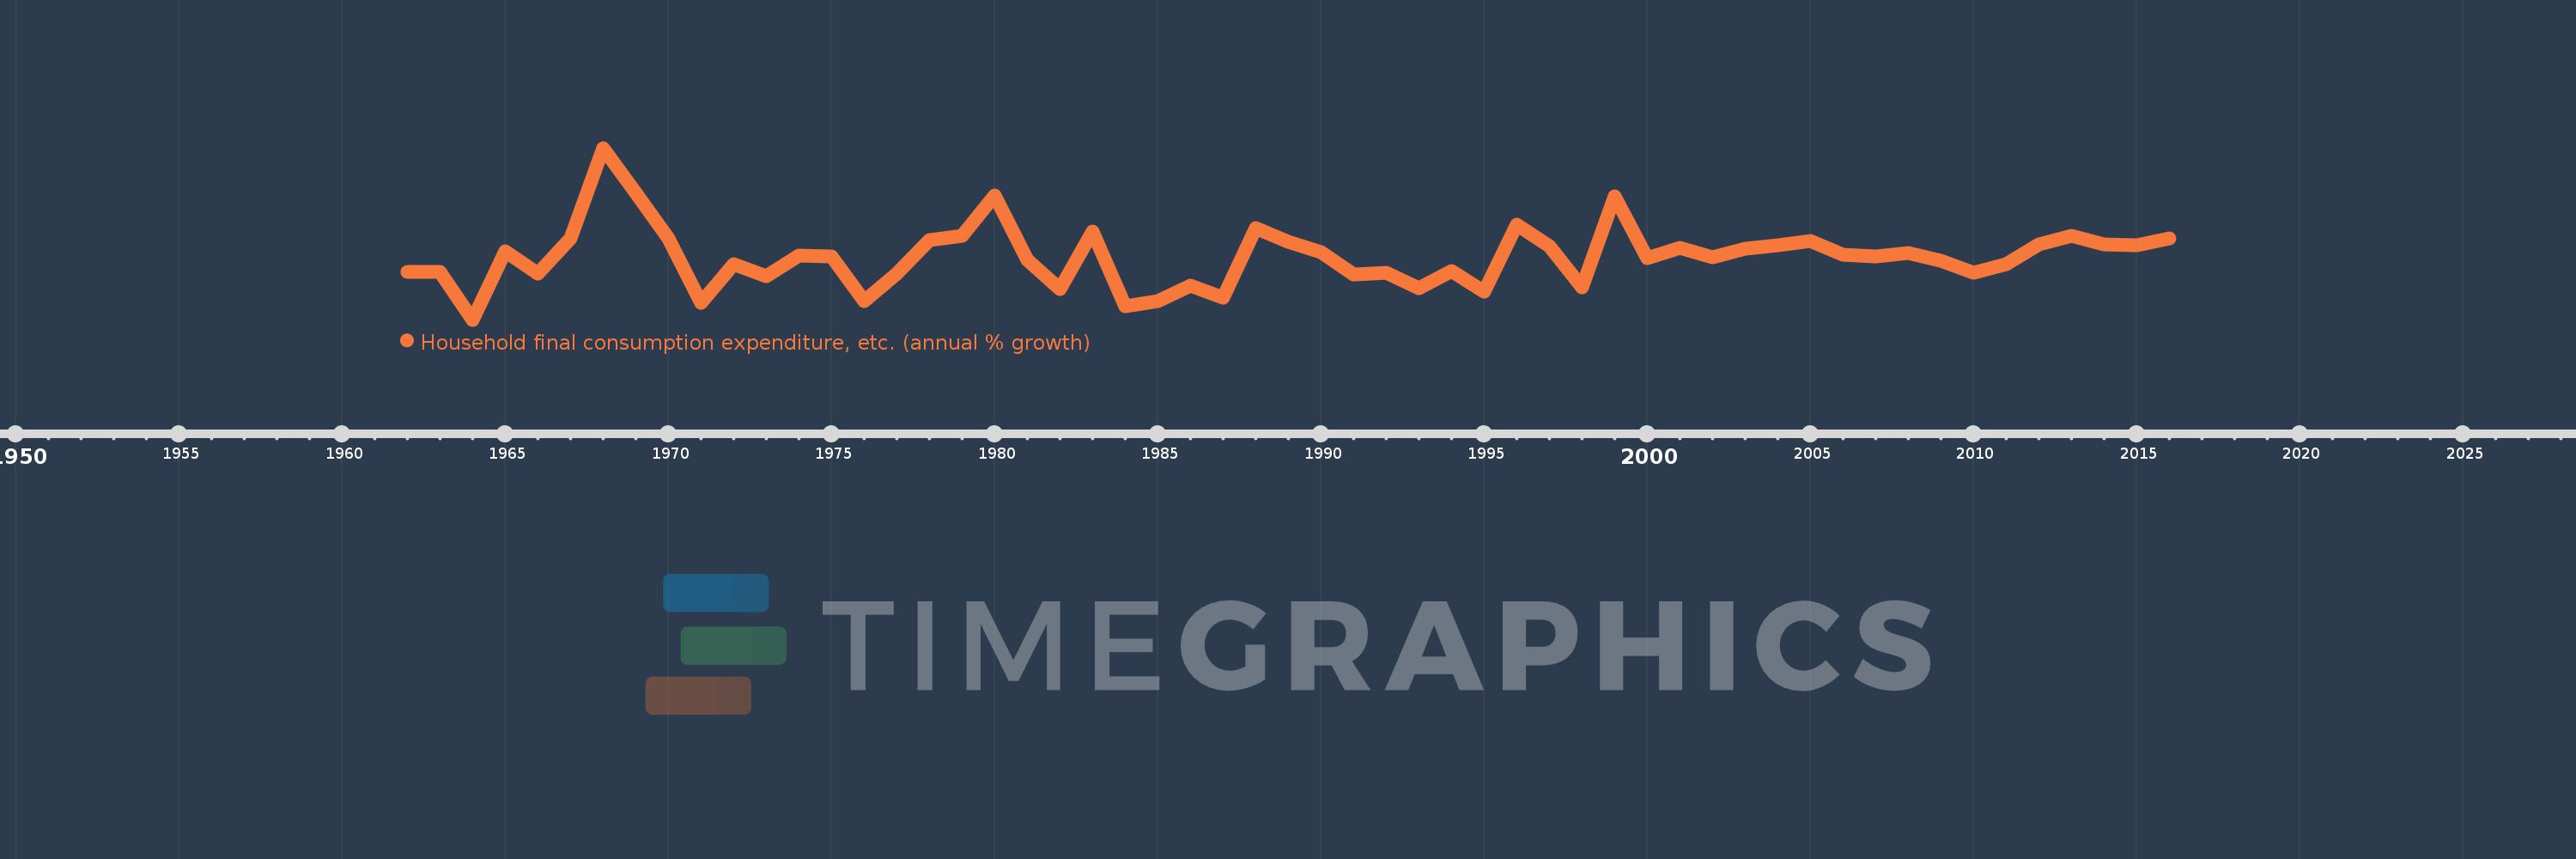
Household final consumption expenditure, etc. (annual % growth)
2016,2015,2014,2013,2012,2011,2010,2009,2008,2007,2006,2005,2004,2003,2002,2001,2000,1999,1998,1997,1996,1995,1994,1993,1992,1991,1990,1989,1988,1987,1986,1985,1984,1983,1982,1981,1980,1979,1978,1977,1976,1975,1974,1973,1972,1971,1970,1969,1968,1967,1966,1965,1964,1963,1962
This statistics in other country:
AlbaniaAlgeriaAntigua and BarbudaArab WorldArgentinaArmeniaAustraliaAustriaAzerbaijanBahamas, TheBahrainBangladeshBarbadosBelarusBelgiumBelizeBeninBhutanBoliviaBosnia and HerzegovinaBotswanaBrazilBrunei DarussalamBulgariaBurkina FasoBurundiCabo VerdeCambodiaCameroonCanadaCaribbean small statesCentral Europe and the BalticsChadChileColombiaComorosCongo, Dem. Rep.Congo, Rep.Costa RicaCote d'IvoireCroatiaCubaCyprusCzech RepublicDenmarkDjiboutiDominican RepublicEarly-demographic dividendEast Asia & PacificEcuadorEgypt, Arab Rep.El SalvadorEquatorial GuineaEritreaEstoniaEthiopiaEuro areaEurope & Central AsiaEurope & Central Asia (excluding high income)Europe & Central Asia (IDA & IBRD countries)European UnionFijiFinlandFranceGabonGambia, TheGeorgiaGermanyGhanaGreeceGuatemalaGuineaGuinea-BissauHaitiHeavily indebted poor countries (HIPC)High incomeHondurasHong Kong SAR, ChinaHungaryIBRD onlyIcelandIDA & IBRD totalIDA blendIDA onlyIDA totalIndiaIndonesiaIran, Islamic Rep.IrelandIsraelItalyJamaicaJapanJordanKazakhstanKenyaKorea, Rep.KosovoKuwaitKyrgyz RepublicLao PDRLatin America & Caribbean Latin America & Caribbean (excluding high income)Latin America & the Caribbean (IDA & IBRD countries)LatviaLeast developed countries: UN classificationLebanonLiberiaLithuaniaLow & middle incomeLow incomeLower middle incomeLuxembourgMacao SAR, ChinaMacedonia, FYRMadagascarMalawiMalaysiaMaliMaltaMarshall IslandsMauritaniaMauritiusMexicoMiddle East & North AfricaMiddle East & North Africa (excluding high income)Middle East & North Africa (IDA & IBRD countries)Middle incomeMoldovaMongoliaMontenegroMoroccoMozambiqueNamibiaNepalNetherlandsNew ZealandNicaraguaNigerNigeriaNorth AmericaNorwayOECD membersOmanOther small statesPakistanPanamaPapua New GuineaParaguayPeruPhilippinesPolandPortugalPost-demographic dividendPre-demographic dividendPuerto RicoQatarRomaniaRussian FederationRwandaSaudi ArabiaSenegalSerbiaSeychellesSierra LeoneSingaporeSlovak RepublicSloveniaSmall statesSomaliaSouth AfricaSouth AsiaSouth Asia (IDA & IBRD)South SudanSpainSri LankaSub-Saharan Africa Sub-Saharan Africa (excluding high income)Sub-Saharan Africa (IDA & IBRD countries)SudanSurinameSwazilandSwedenSwitzerlandSyrian Arab RepublicTajikistanTanzaniaThailandTimor-LesteTogoTrinidad and TobagoTunisiaTurkeyTurkmenistanUgandaUkraineUnited Arab EmiratesUnited KingdomUnited StatesUpper middle incomeUruguayVanuatuVenezuela, RBVietnamWest Bank and GazaWorldZambiaZimbabwe Timeline:
This timeline shows a graph from 1962 to 2016 of Philippines. No data until 1961. Number of actual observations by date: 55.
Source name:
World Development Indicators
Source organization:
World Bank national accounts data, and OECD National Accounts data files.
Categories, topics:
Economy & Growth
Last updated:
apr 23, 2017
Indicators value changes by year
Minimum:
-3.061
jan 1, 1964
Maximum:
16.674
jan 1, 1968
At the date of observation
Value
Absolute change
Change from previous value
jan 1, 1962
2.461
+2.461
0.0%
jan 1, 1963
2.466
+0.005
0.2%
jan 1, 1964
-3.061
-5.527
-224.15%
jan 1, 1965
4.797
+7.858
-256.68%
jan 1, 1966
2.202
-2.595
-54.1%
jan 1, 1967
6.262
+4.06
184.42%
jan 1, 1968
16.674
+10.411
166.26%
jan 1, 1969
11.5
-5.173
-31.03%
jan 1, 1970
6.306
-5.194
-45.17%
jan 1, 1971
-1.15
-7.456
-118.23%
jan 1, 1972
3.338
+4.487
-390.3%
jan 1, 1973
1.936
-1.402
-42.01%
jan 1, 1974
4.294
+2.359
121.85%
jan 1, 1975
4.202
-0.093
-2.16%
jan 1, 1976
-0.958
-5.16
-122.81%
jan 1, 1977
2.195
+3.153
-328.96%
jan 1, 1978
6.064
+3.87
176.32%
jan 1, 1979
6.613
+0.549
9.05%
jan 1, 1980
11.198
+4.585
69.33%
jan 1, 1981
3.816
-7.382
-65.92%
jan 1, 1982
0.474
-3.342
-87.58%
jan 1, 1983
7.092
+6.618
1.4K%
jan 1, 1984
-1.554
-8.646
-121.91%
jan 1, 1985
-0.946
+0.608
-39.1%
jan 1, 1986
0.892
+1.838
-194.24%
jan 1, 1987
-0.512
-1.404
-157.39%
jan 1, 1988
7.502
+8.014
-1.57K%
jan 1, 1989
5.907
-1.595
-21.27%
jan 1, 1990
4.725
-1.182
-20.01%
jan 1, 1991
2.151
-2.573
-54.47%
jan 1, 1992
2.305
+0.154
7.15%
jan 1, 1993
0.562
-1.744
-75.64%
jan 1, 1994
2.516
+1.954
347.96%
jan 1, 1995
0.191
-2.324
-92.39%
jan 1, 1996
7.893
+7.702
4.03K%
jan 1, 1997
5.366
-2.528
-32.02%
jan 1, 1998
0.663
-4.702
-87.64%
jan 1, 1999
11.109
+10.446
1.57K%
jan 1, 2000
4.028
-7.081
-63.74%
jan 1, 2001
5.197
+1.169
29.02%
jan 1, 2002
4.085
-1.112
-21.41%
jan 1, 2003
5.109
+1.024
25.07%
jan 1, 2004
5.494
+0.386
7.55%
jan 1, 2005
5.971
+0.476
8.67%
jan 1, 2006
4.425
-1.546
-25.9%
jan 1, 2007
4.182
-0.242
-5.48%
jan 1, 2008
4.61
+0.427
10.22%
jan 1, 2009
3.68
-0.93
-20.17%
jan 1, 2010
2.333
-1.347
-36.6%
jan 1, 2011
3.351
+1.017
43.6%
jan 1, 2012
5.59
+2.24
66.85%
jan 1, 2013
6.627
+1.037
18.55%
jan 1, 2014
5.626
-1.002
-15.11%
jan 1, 2015
5.536
-0.09
-1.6%
jan 1, 2016
6.299
+0.764
13.79%
Ranking of countries by current statistics by years


Comments: