29
/
en
AIzaSyAYiBZKx7MnpbEhh9jyipgxe19OcubqV5w
April 1, 2024
203023
Mozambique
MOZ
true
2
1
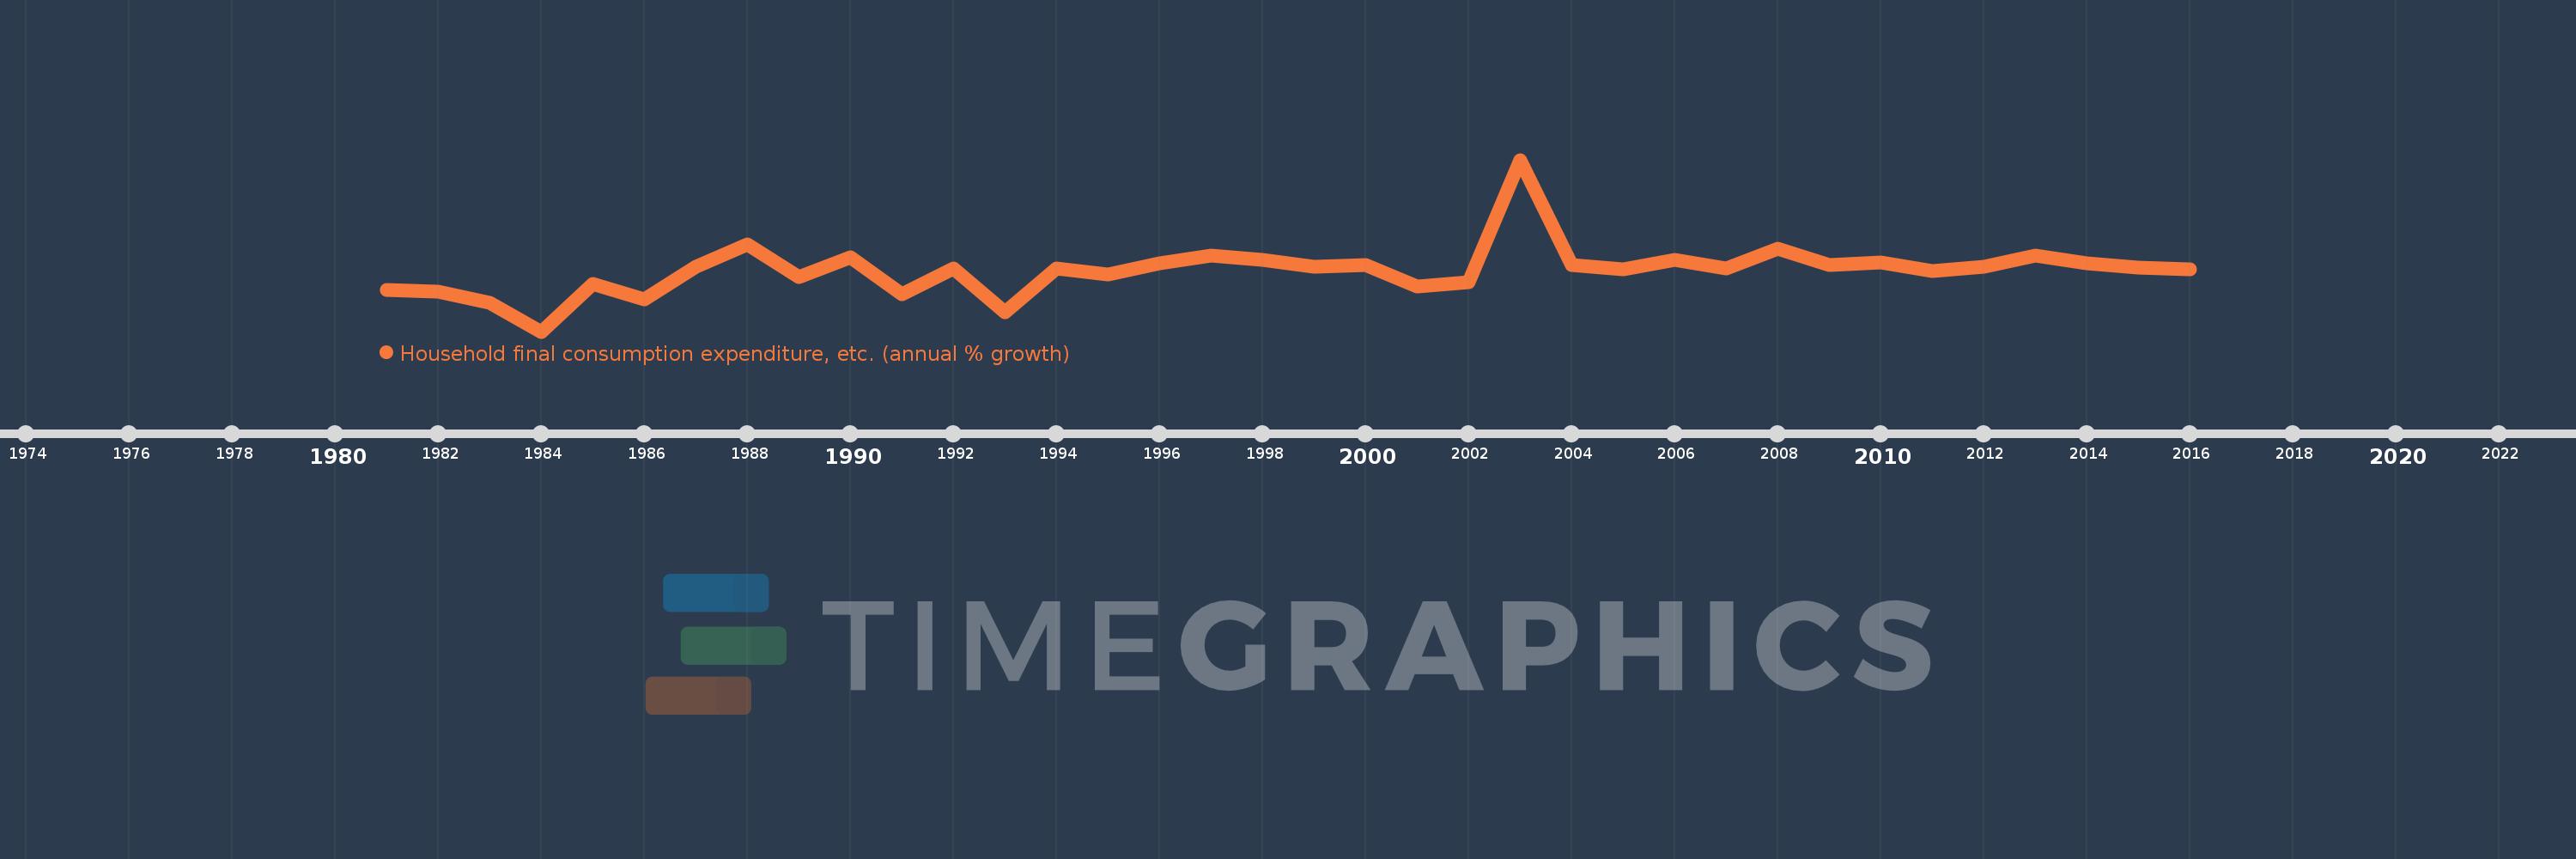
Household final consumption expenditure, etc. (annual % growth)
2016,2015,2014,2013,2012,2011,2010,2009,2008,2007,2006,2005,2004,2003,2002,2001,2000,1999,1998,1997,1996,1995,1994,1993,1992,1991,1990,1989,1988,1987,1986,1985,1984,1983,1982,1981
This statistics in other country:
AlbaniaAlgeriaAntigua and BarbudaArab WorldArgentinaArmeniaAustraliaAustriaAzerbaijanBahamas, TheBahrainBangladeshBarbadosBelarusBelgiumBelizeBeninBhutanBoliviaBosnia and HerzegovinaBotswanaBrazilBrunei DarussalamBulgariaBurkina FasoBurundiCabo VerdeCambodiaCameroonCanadaCaribbean small statesCentral Europe and the BalticsChadChileColombiaComorosCongo, Dem. Rep.Congo, Rep.Costa RicaCote d'IvoireCroatiaCubaCyprusCzech RepublicDenmarkDjiboutiDominican RepublicEarly-demographic dividendEast Asia & PacificEcuadorEgypt, Arab Rep.El SalvadorEquatorial GuineaEritreaEstoniaEthiopiaEuro areaEurope & Central AsiaEurope & Central Asia (excluding high income)Europe & Central Asia (IDA & IBRD countries)European UnionFijiFinlandFranceGabonGambia, TheGeorgiaGermanyGhanaGreeceGuatemalaGuineaGuinea-BissauHaitiHeavily indebted poor countries (HIPC)High incomeHondurasHong Kong SAR, ChinaHungaryIBRD onlyIcelandIDA & IBRD totalIDA blendIDA onlyIDA totalIndiaIndonesiaIran, Islamic Rep.IrelandIsraelItalyJamaicaJapanJordanKazakhstanKenyaKorea, Rep.KosovoKuwaitKyrgyz RepublicLao PDRLatin America & Caribbean Latin America & Caribbean (excluding high income)Latin America & the Caribbean (IDA & IBRD countries)LatviaLeast developed countries: UN classificationLebanonLiberiaLithuaniaLow & middle incomeLow incomeLower middle incomeLuxembourgMacao SAR, ChinaMacedonia, FYRMadagascarMalawiMalaysiaMaliMaltaMarshall IslandsMauritaniaMauritiusMexicoMiddle East & North AfricaMiddle East & North Africa (excluding high income)Middle East & North Africa (IDA & IBRD countries)Middle incomeMoldovaMongoliaMontenegroMoroccoMozambiqueNamibiaNepalNetherlandsNew ZealandNicaraguaNigerNigeriaNorth AmericaNorwayOECD membersOmanOther small statesPakistanPanamaPapua New GuineaParaguayPeruPhilippinesPolandPortugalPost-demographic dividendPre-demographic dividendPuerto RicoQatarRomaniaRussian FederationRwandaSaudi ArabiaSenegalSerbiaSeychellesSierra LeoneSingaporeSlovak RepublicSloveniaSmall statesSomaliaSouth AfricaSouth AsiaSouth Asia (IDA & IBRD)South SudanSpainSri LankaSub-Saharan Africa Sub-Saharan Africa (excluding high income)Sub-Saharan Africa (IDA & IBRD countries)SudanSurinameSwazilandSwedenSwitzerlandSyrian Arab RepublicTajikistanTanzaniaThailandTimor-LesteTogoTrinidad and TobagoTunisiaTurkeyTurkmenistanUgandaUkraineUnited Arab EmiratesUnited KingdomUnited StatesUpper middle incomeUruguayVanuatuVenezuela, RBVietnamWest Bank and GazaWorldZambiaZimbabwe Timeline:
This timeline shows a graph from 1981 to 2016 of Mozambique. No data until 1980. Number of actual observations by date: 36.
Source name:
World Development Indicators
Source organization:
World Bank national accounts data, and OECD National Accounts data files.
Categories, topics:
Economy & Growth
Last updated:
apr 23, 2017
Indicators value changes by year
Minimum:
-13.824
jan 1, 1984
Maximum:
35.772
jan 1, 2003
At the date of observation
Value
Absolute change
Change from previous value
jan 1, 1981
-1.9
-1.9
0.0%
jan 1, 1982
-2.229
-0.329
17.29%
jan 1, 1983
-5.568
-3.339
149.8%
jan 1, 1984
-13.824
-8.256
148.27%
jan 1, 1985
-0.039
+13.784
-99.71%
jan 1, 1986
-4.502
-4.462
11.3K%
jan 1, 1987
4.843
+9.345
-207.57%
jan 1, 1988
11.376
+6.533
134.9%
jan 1, 1989
1.915
-9.46
-83.16%
jan 1, 1990
7.633
+5.717
298.49%
jan 1, 1991
-3.039
-10.671
-139.81%
jan 1, 1992
4.506
+7.545
-248.28%
jan 1, 1993
-8.292
-12.797
-284.01%
jan 1, 1994
4.423
+12.715
-153.34%
jan 1, 1995
2.624
-1.799
-40.66%
jan 1, 1996
5.787
+3.163
120.52%
jan 1, 1997
8.115
+2.328
40.22%
jan 1, 1998
6.976
-1.139
-14.04%
jan 1, 1999
4.965
-2.011
-28.82%
jan 1, 2000
5.376
+0.411
8.27%
jan 1, 2001
-0.811
-6.187
-115.08%
jan 1, 2002
0.374
+1.185
-146.19%
jan 1, 2003
35.772
+35.397
9.45K%
jan 1, 2004
5.41
-30.362
-84.88%
jan 1, 2005
4.167
-1.243
-22.98%
jan 1, 2006
6.921
+2.754
66.11%
jan 1, 2007
4.335
-2.586
-37.36%
jan 1, 2008
10.226
+5.89
135.86%
jan 1, 2009
5.458
-4.768
-46.63%
jan 1, 2010
6.173
+0.715
13.1%
jan 1, 2011
3.614
-2.559
-41.46%
jan 1, 2012
4.946
+1.332
36.87%
jan 1, 2013
8.156
+3.21
64.89%
jan 1, 2014
5.89
-2.266
-27.79%
jan 1, 2015
4.686
-1.203
-20.43%
jan 1, 2016
4.149
-0.538
-11.48%
Ranking of countries by current statistics by years


Comments: