29
/
en
AIzaSyAYiBZKx7MnpbEhh9jyipgxe19OcubqV5w
April 1, 2024
216528
Pakistan
PAK
true
2
1
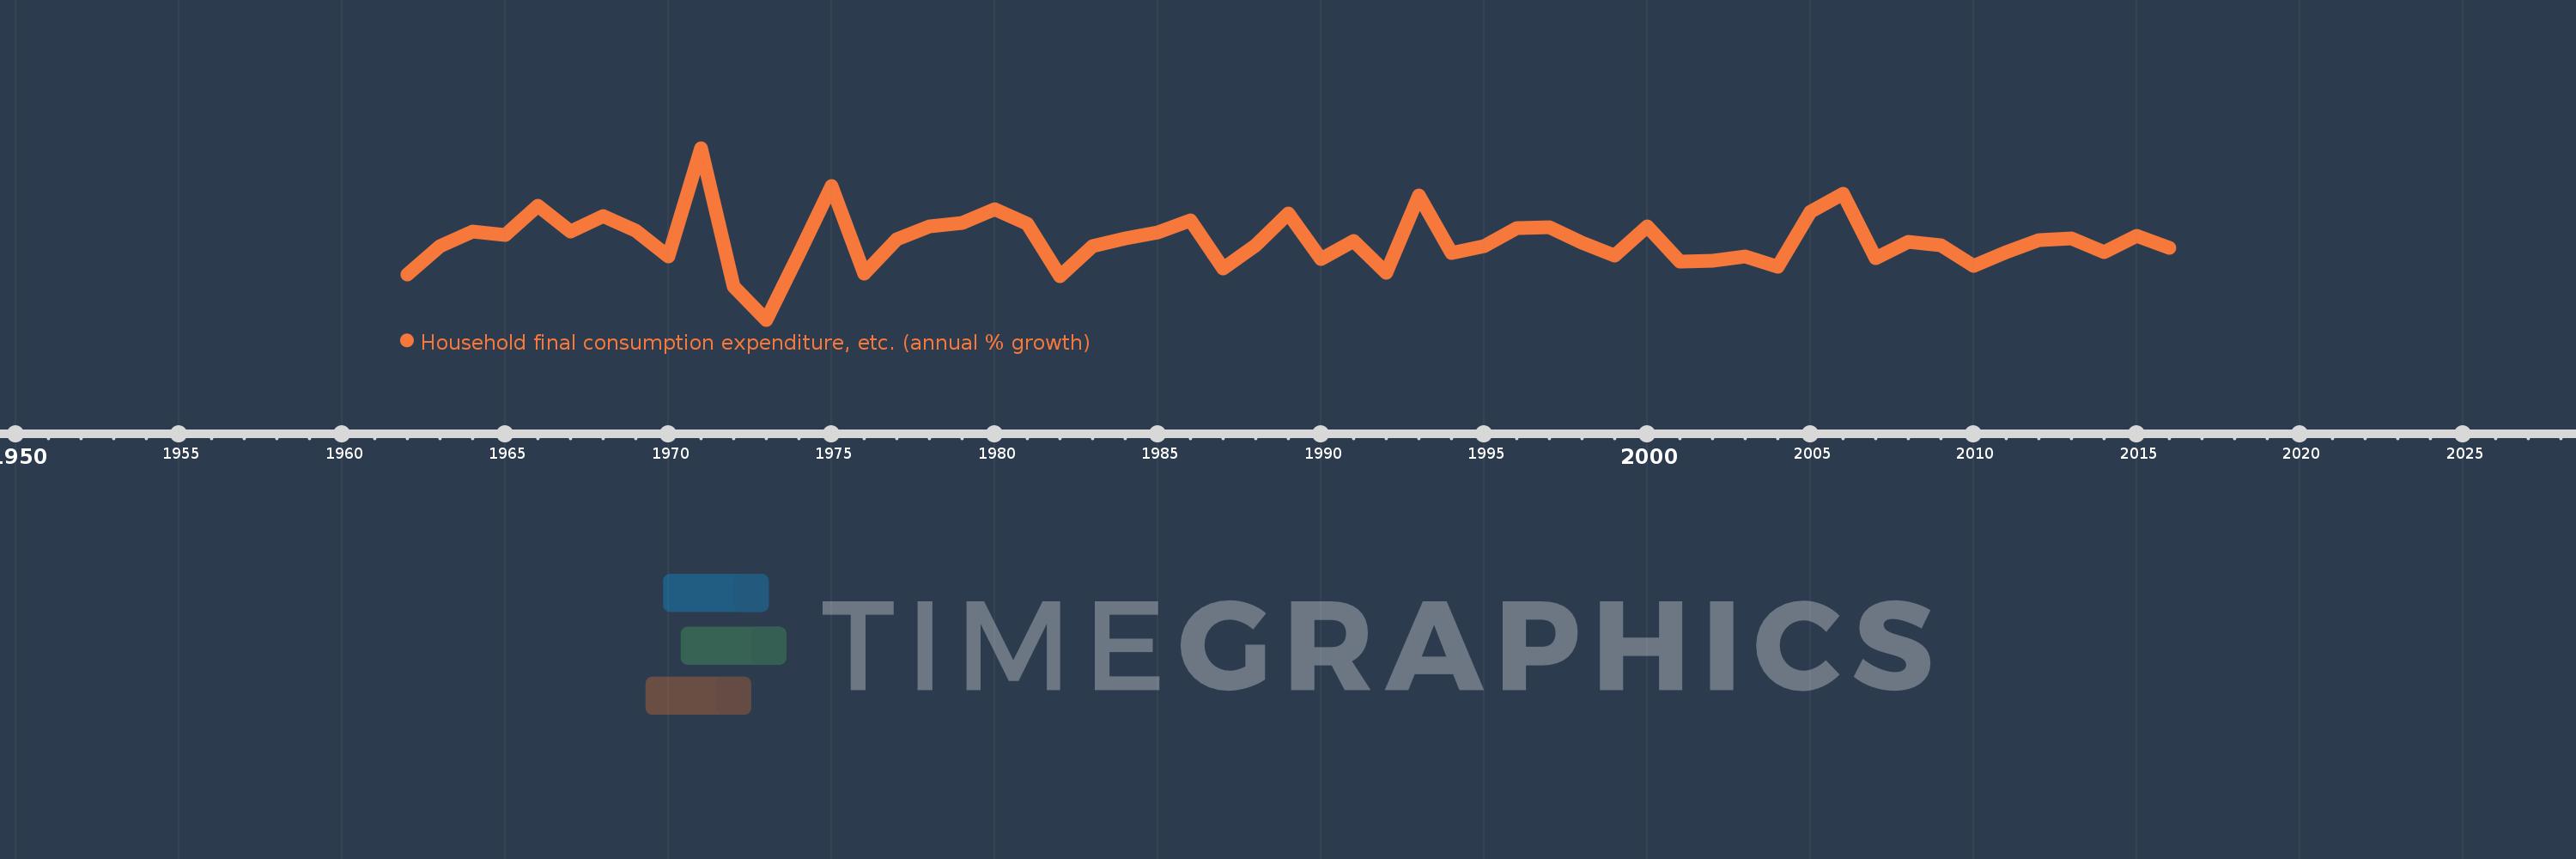
Household final consumption expenditure, etc. (annual % growth)
2016,2015,2014,2013,2012,2011,2010,2009,2008,2007,2006,2005,2004,2003,2002,2001,2000,1999,1998,1997,1996,1995,1994,1993,1992,1991,1990,1989,1988,1987,1986,1985,1984,1983,1982,1981,1980,1979,1978,1977,1976,1975,1974,1973,1972,1971,1970,1969,1968,1967,1966,1965,1964,1963,1962
This statistics in other country:
AlbaniaAlgeriaAntigua and BarbudaArab WorldArgentinaArmeniaAustraliaAustriaAzerbaijanBahamas, TheBahrainBangladeshBarbadosBelarusBelgiumBelizeBeninBhutanBoliviaBosnia and HerzegovinaBotswanaBrazilBrunei DarussalamBulgariaBurkina FasoBurundiCabo VerdeCambodiaCameroonCanadaCaribbean small statesCentral Europe and the BalticsChadChileColombiaComorosCongo, Dem. Rep.Congo, Rep.Costa RicaCote d'IvoireCroatiaCubaCyprusCzech RepublicDenmarkDjiboutiDominican RepublicEarly-demographic dividendEast Asia & PacificEcuadorEgypt, Arab Rep.El SalvadorEquatorial GuineaEritreaEstoniaEthiopiaEuro areaEurope & Central AsiaEurope & Central Asia (excluding high income)Europe & Central Asia (IDA & IBRD countries)European UnionFijiFinlandFranceGabonGambia, TheGeorgiaGermanyGhanaGreeceGuatemalaGuineaGuinea-BissauHaitiHeavily indebted poor countries (HIPC)High incomeHondurasHong Kong SAR, ChinaHungaryIBRD onlyIcelandIDA & IBRD totalIDA blendIDA onlyIDA totalIndiaIndonesiaIran, Islamic Rep.IrelandIsraelItalyJamaicaJapanJordanKazakhstanKenyaKorea, Rep.KosovoKuwaitKyrgyz RepublicLao PDRLatin America & Caribbean Latin America & Caribbean (excluding high income)Latin America & the Caribbean (IDA & IBRD countries)LatviaLeast developed countries: UN classificationLebanonLiberiaLithuaniaLow & middle incomeLow incomeLower middle incomeLuxembourgMacao SAR, ChinaMacedonia, FYRMadagascarMalawiMalaysiaMaliMaltaMarshall IslandsMauritaniaMauritiusMexicoMiddle East & North AfricaMiddle East & North Africa (excluding high income)Middle East & North Africa (IDA & IBRD countries)Middle incomeMoldovaMongoliaMontenegroMoroccoMozambiqueNamibiaNepalNetherlandsNew ZealandNicaraguaNigerNigeriaNorth AmericaNorwayOECD membersOmanOther small statesPakistanPanamaPapua New GuineaParaguayPeruPhilippinesPolandPortugalPost-demographic dividendPre-demographic dividendPuerto RicoQatarRomaniaRussian FederationRwandaSaudi ArabiaSenegalSerbiaSeychellesSierra LeoneSingaporeSlovak RepublicSloveniaSmall statesSomaliaSouth AfricaSouth AsiaSouth Asia (IDA & IBRD)South SudanSpainSri LankaSub-Saharan Africa Sub-Saharan Africa (excluding high income)Sub-Saharan Africa (IDA & IBRD countries)SudanSurinameSwazilandSwedenSwitzerlandSyrian Arab RepublicTajikistanTanzaniaThailandTimor-LesteTogoTrinidad and TobagoTunisiaTurkeyTurkmenistanUgandaUkraineUnited Arab EmiratesUnited KingdomUnited StatesUpper middle incomeUruguayVanuatuVenezuela, RBVietnamWest Bank and GazaWorldZambiaZimbabwe Timeline:
This timeline shows a graph from 1962 to 2016 of Pakistan. No data until 1961. Number of actual observations by date: 55.
Source name:
World Development Indicators
Source organization:
World Bank national accounts data, and OECD National Accounts data files.
Categories, topics:
Economy & Growth
Last updated:
apr 23, 2017
Indicators value changes by year
Minimum:
-11.41
jan 1, 1973
Maximum:
23.235
jan 1, 1971
At the date of observation
Value
Absolute change
Change from previous value
jan 1, 1962
-2.356
-2.356
0.0%
jan 1, 1963
3.462
+5.818
-246.95%
jan 1, 1964
6.397
+2.935
84.77%
jan 1, 1965
5.721
-0.676
-10.57%
jan 1, 1966
11.593
+5.872
102.64%
jan 1, 1967
6.398
-5.195
-44.81%
jan 1, 1968
9.471
+3.073
48.03%
jan 1, 1969
6.497
-2.973
-31.4%
jan 1, 1970
1.357
-5.141
-79.12%
jan 1, 1971
23.235
+21.878
1.61K%
jan 1, 1972
-4.779
-28.013
-120.57%
jan 1, 1973
-11.41
-6.631
138.77%
jan 1, 1974
1.862
+13.272
-116.32%
jan 1, 1975
15.638
+13.776
739.89%
jan 1, 1976
-2.154
-17.792
-113.77%
jan 1, 1977
4.82
+6.974
-323.8%
jan 1, 1978
7.391
+2.571
53.34%
jan 1, 1979
8.192
+0.801
10.84%
jan 1, 1980
10.898
+2.706
33.04%
jan 1, 1981
7.887
-3.011
-27.63%
jan 1, 1982
-2.636
-10.523
-133.42%
jan 1, 1983
3.517
+6.153
-233.45%
jan 1, 1984
5.02
+1.503
42.73%
jan 1, 1985
6.166
+1.146
22.82%
jan 1, 1986
8.681
+2.515
40.79%
jan 1, 1987
-1.074
-9.755
-112.37%
jan 1, 1988
3.652
+4.726
-439.94%
jan 1, 1989
10.083
+6.431
176.1%
jan 1, 1990
0.816
-9.267
-91.91%
jan 1, 1991
4.499
+3.683
451.26%
jan 1, 1992
-1.885
-6.384
-141.89%
jan 1, 1993
13.702
+15.586
-826.96%
jan 1, 1994
2.119
-11.583
-84.54%
jan 1, 1995
3.472
+1.354
63.9%
jan 1, 1996
7.057
+3.584
103.23%
jan 1, 1997
7.17
+0.113
1.61%
jan 1, 1998
4.142
-3.028
-42.24%
jan 1, 1999
1.558
-2.584
-62.39%
jan 1, 2000
7.472
+5.914
379.68%
jan 1, 2001
0.367
-7.105
-95.09%
jan 1, 2002
0.545
+0.178
48.58%
jan 1, 2003
1.402
+0.856
157.02%
jan 1, 2004
-0.796
-2.197
-156.78%
jan 1, 2005
10.412
+11.208
-1.41K%
jan 1, 2006
13.974
+3.562
34.21%
jan 1, 2007
1.017
-12.957
-92.72%
jan 1, 2008
4.318
+3.301
324.69%
jan 1, 2009
3.559
-0.759
-17.57%
jan 1, 2010
-0.48
-4.039
-113.48%
jan 1, 2011
2.208
+2.688
-560.0%
jan 1, 2012
4.586
+2.378
107.73%
jan 1, 2013
5.033
+0.447
9.75%
jan 1, 2014
2.139
-2.895
-57.51%
jan 1, 2015
5.587
+3.449
161.25%
jan 1, 2016
3.155
-2.432
-43.53%
Ranking of countries by current statistics by years


Comments: