29
/
en
AIzaSyAYiBZKx7MnpbEhh9jyipgxe19OcubqV5w
April 1, 2024
92676
Brunei Darussalam
BRN
true
2
1
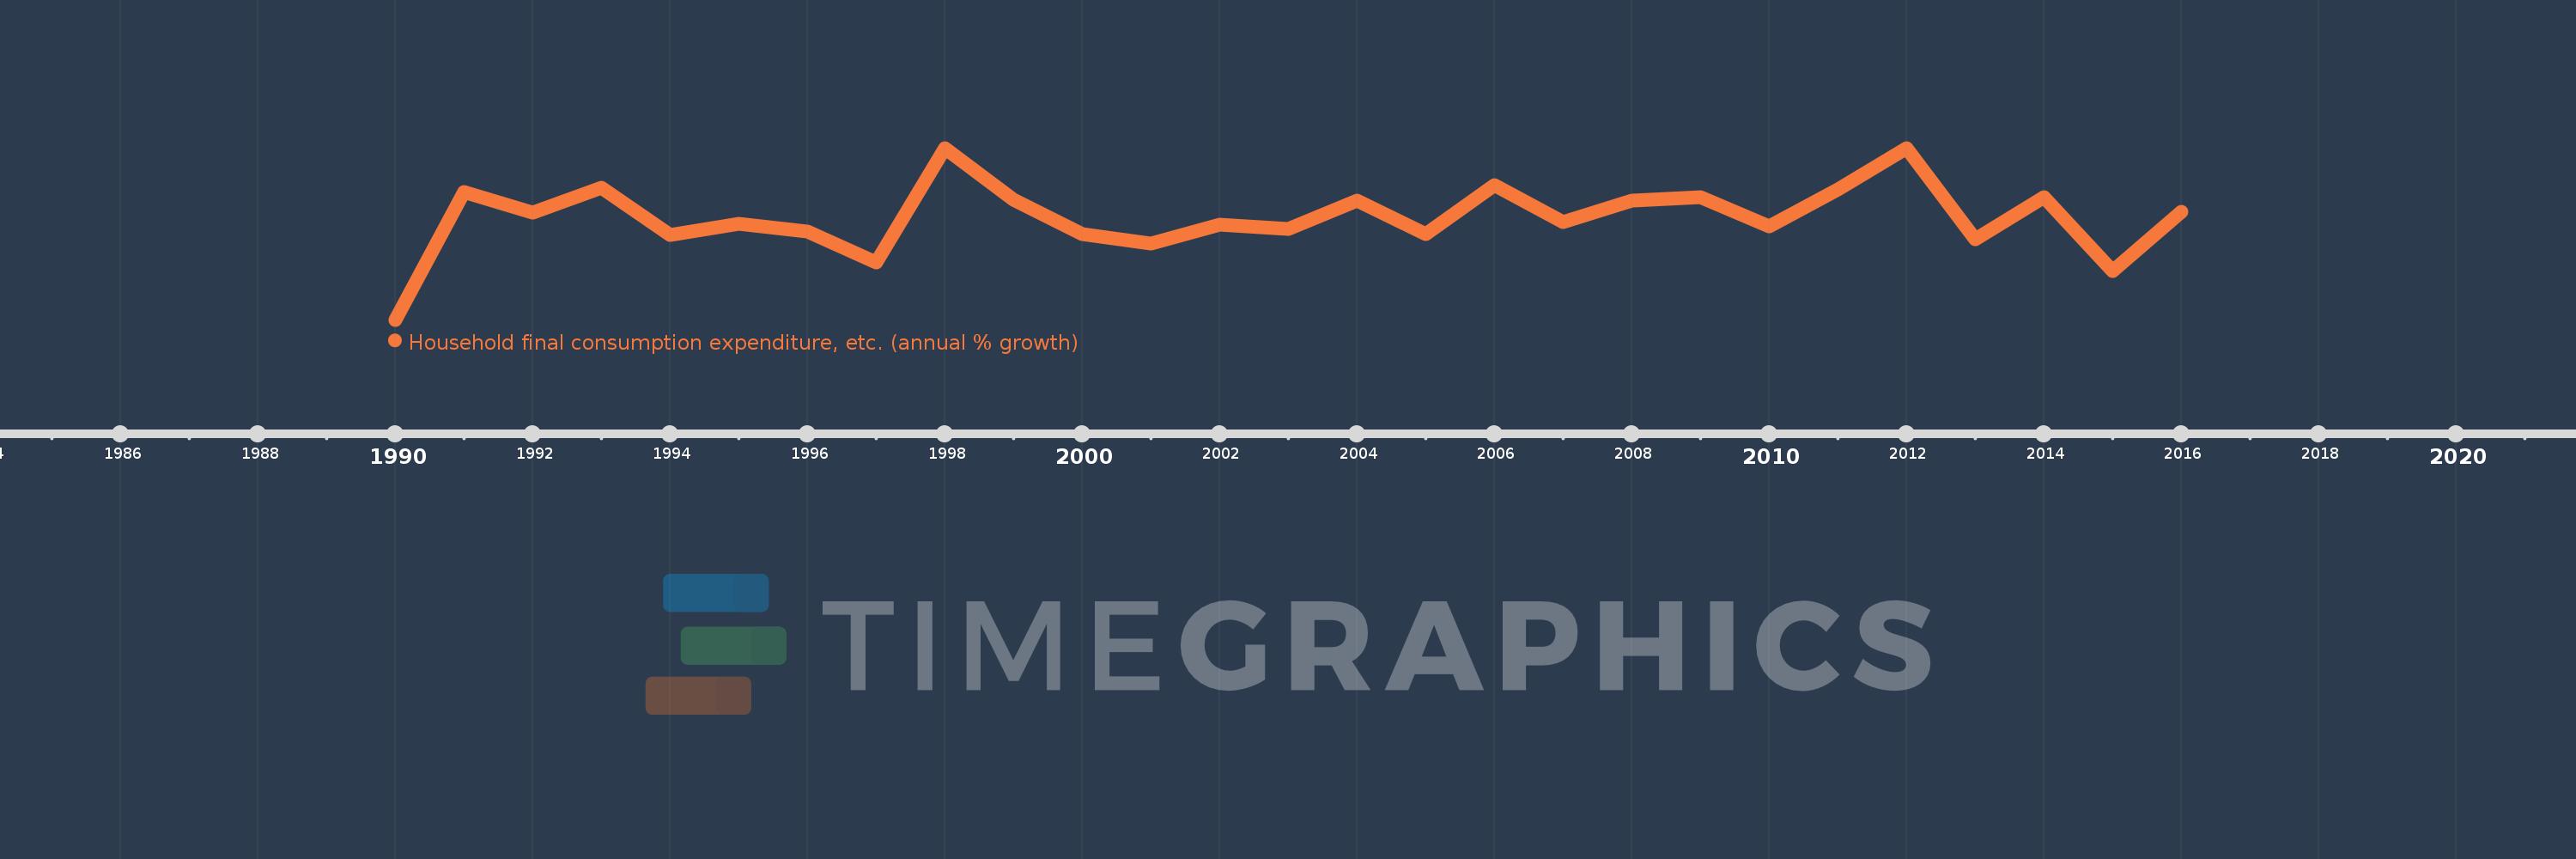
Household final consumption expenditure, etc. (annual % growth)
2016,2015,2014,2013,2012,2011,2010,2009,2008,2007,2006,2005,2004,2003,2002,2001,2000,1999,1998,1997,1996,1995,1994,1993,1992,1991,1990
This statistics in other country:
AlbaniaAlgeriaAntigua and BarbudaArab WorldArgentinaArmeniaAustraliaAustriaAzerbaijanBahamas, TheBahrainBangladeshBarbadosBelarusBelgiumBelizeBeninBhutanBoliviaBosnia and HerzegovinaBotswanaBrazilBrunei DarussalamBulgariaBurkina FasoBurundiCabo VerdeCambodiaCameroonCanadaCaribbean small statesCentral Europe and the BalticsChadChileColombiaComorosCongo, Dem. Rep.Congo, Rep.Costa RicaCote d'IvoireCroatiaCubaCyprusCzech RepublicDenmarkDjiboutiDominican RepublicEarly-demographic dividendEast Asia & PacificEcuadorEgypt, Arab Rep.El SalvadorEquatorial GuineaEritreaEstoniaEthiopiaEuro areaEurope & Central AsiaEurope & Central Asia (excluding high income)Europe & Central Asia (IDA & IBRD countries)European UnionFijiFinlandFranceGabonGambia, TheGeorgiaGermanyGhanaGreeceGuatemalaGuineaGuinea-BissauHaitiHeavily indebted poor countries (HIPC)High incomeHondurasHong Kong SAR, ChinaHungaryIBRD onlyIcelandIDA & IBRD totalIDA blendIDA onlyIDA totalIndiaIndonesiaIran, Islamic Rep.IrelandIsraelItalyJamaicaJapanJordanKazakhstanKenyaKorea, Rep.KosovoKuwaitKyrgyz RepublicLao PDRLatin America & Caribbean Latin America & Caribbean (excluding high income)Latin America & the Caribbean (IDA & IBRD countries)LatviaLeast developed countries: UN classificationLebanonLiberiaLithuaniaLow & middle incomeLow incomeLower middle incomeLuxembourgMacao SAR, ChinaMacedonia, FYRMadagascarMalawiMalaysiaMaliMaltaMarshall IslandsMauritaniaMauritiusMexicoMiddle East & North AfricaMiddle East & North Africa (excluding high income)Middle East & North Africa (IDA & IBRD countries)Middle incomeMoldovaMongoliaMontenegroMoroccoMozambiqueNamibiaNepalNetherlandsNew ZealandNicaraguaNigerNigeriaNorth AmericaNorwayOECD membersOmanOther small statesPakistanPanamaPapua New GuineaParaguayPeruPhilippinesPolandPortugalPost-demographic dividendPre-demographic dividendPuerto RicoQatarRomaniaRussian FederationRwandaSaudi ArabiaSenegalSerbiaSeychellesSierra LeoneSingaporeSlovak RepublicSloveniaSmall statesSomaliaSouth AfricaSouth AsiaSouth Asia (IDA & IBRD)South SudanSpainSri LankaSub-Saharan Africa Sub-Saharan Africa (excluding high income)Sub-Saharan Africa (IDA & IBRD countries)SudanSurinameSwazilandSwedenSwitzerlandSyrian Arab RepublicTajikistanTanzaniaThailandTimor-LesteTogoTrinidad and TobagoTunisiaTurkeyTurkmenistanUgandaUkraineUnited Arab EmiratesUnited KingdomUnited StatesUpper middle incomeUruguayVanuatuVenezuela, RBVietnamWest Bank and GazaWorldZambiaZimbabwe Timeline:
This timeline shows a graph from 1990 to 2016 of Brunei Darussalam. No data until 1989. Number of actual observations by date: 27.
Source name:
World Development Indicators
Source organization:
World Bank national accounts data, and OECD National Accounts data files.
Categories, topics:
Economy & Growth
Last updated:
apr 23, 2017
Indicators value changes by year
Minimum:
-46.614
jan 1, 1990
Maximum:
35.804
jan 1, 1998
At the date of observation
Value
Absolute change
Change from previous value
jan 1, 1990
-46.614
-46.614
0.0%
jan 1, 1991
14.596
+61.21
-131.31%
jan 1, 1992
4.864
-9.731
-66.67%
jan 1, 1993
16.785
+11.92
245.05%
jan 1, 1994
-5.913
-22.697
-135.23%
jan 1, 1995
-0.451
+5.461
-92.37%
jan 1, 1996
-4.306
-3.854
854.31%
jan 1, 1997
-19.215
-14.91
346.28%
jan 1, 1998
35.804
+55.019
-286.33%
jan 1, 1999
11.132
-24.672
-68.91%
jan 1, 2000
-5.383
-16.515
-148.36%
jan 1, 2001
-10.222
-4.839
89.9%
jan 1, 2002
-0.883
+9.339
-91.36%
jan 1, 2003
-2.867
-1.984
224.72%
jan 1, 2004
10.63
+13.497
-470.79%
jan 1, 2005
-5.376
-16.006
-150.58%
jan 1, 2006
17.976
+23.352
-434.35%
jan 1, 2007
0.296
-17.68
-98.36%
jan 1, 2008
10.351
+10.055
3.4K%
jan 1, 2009
12.21
+1.859
17.96%
jan 1, 2010
-1.885
-14.095
-115.44%
jan 1, 2011
16.096
+17.98
-954.01%
jan 1, 2012
35.795
+19.699
122.39%
jan 1, 2013
-8.01
-43.804
-122.38%
jan 1, 2014
12.143
+20.153
-251.61%
jan 1, 2015
-23.111
-35.254
-290.32%
jan 1, 2016
5.235
+28.346
-122.65%
Ranking of countries by current statistics by years


Comments: