29
/
en
AIzaSyAYiBZKx7MnpbEhh9jyipgxe19OcubqV5w
April 1, 2024
26584
Early-demographic dividend
EAR
false
2
1
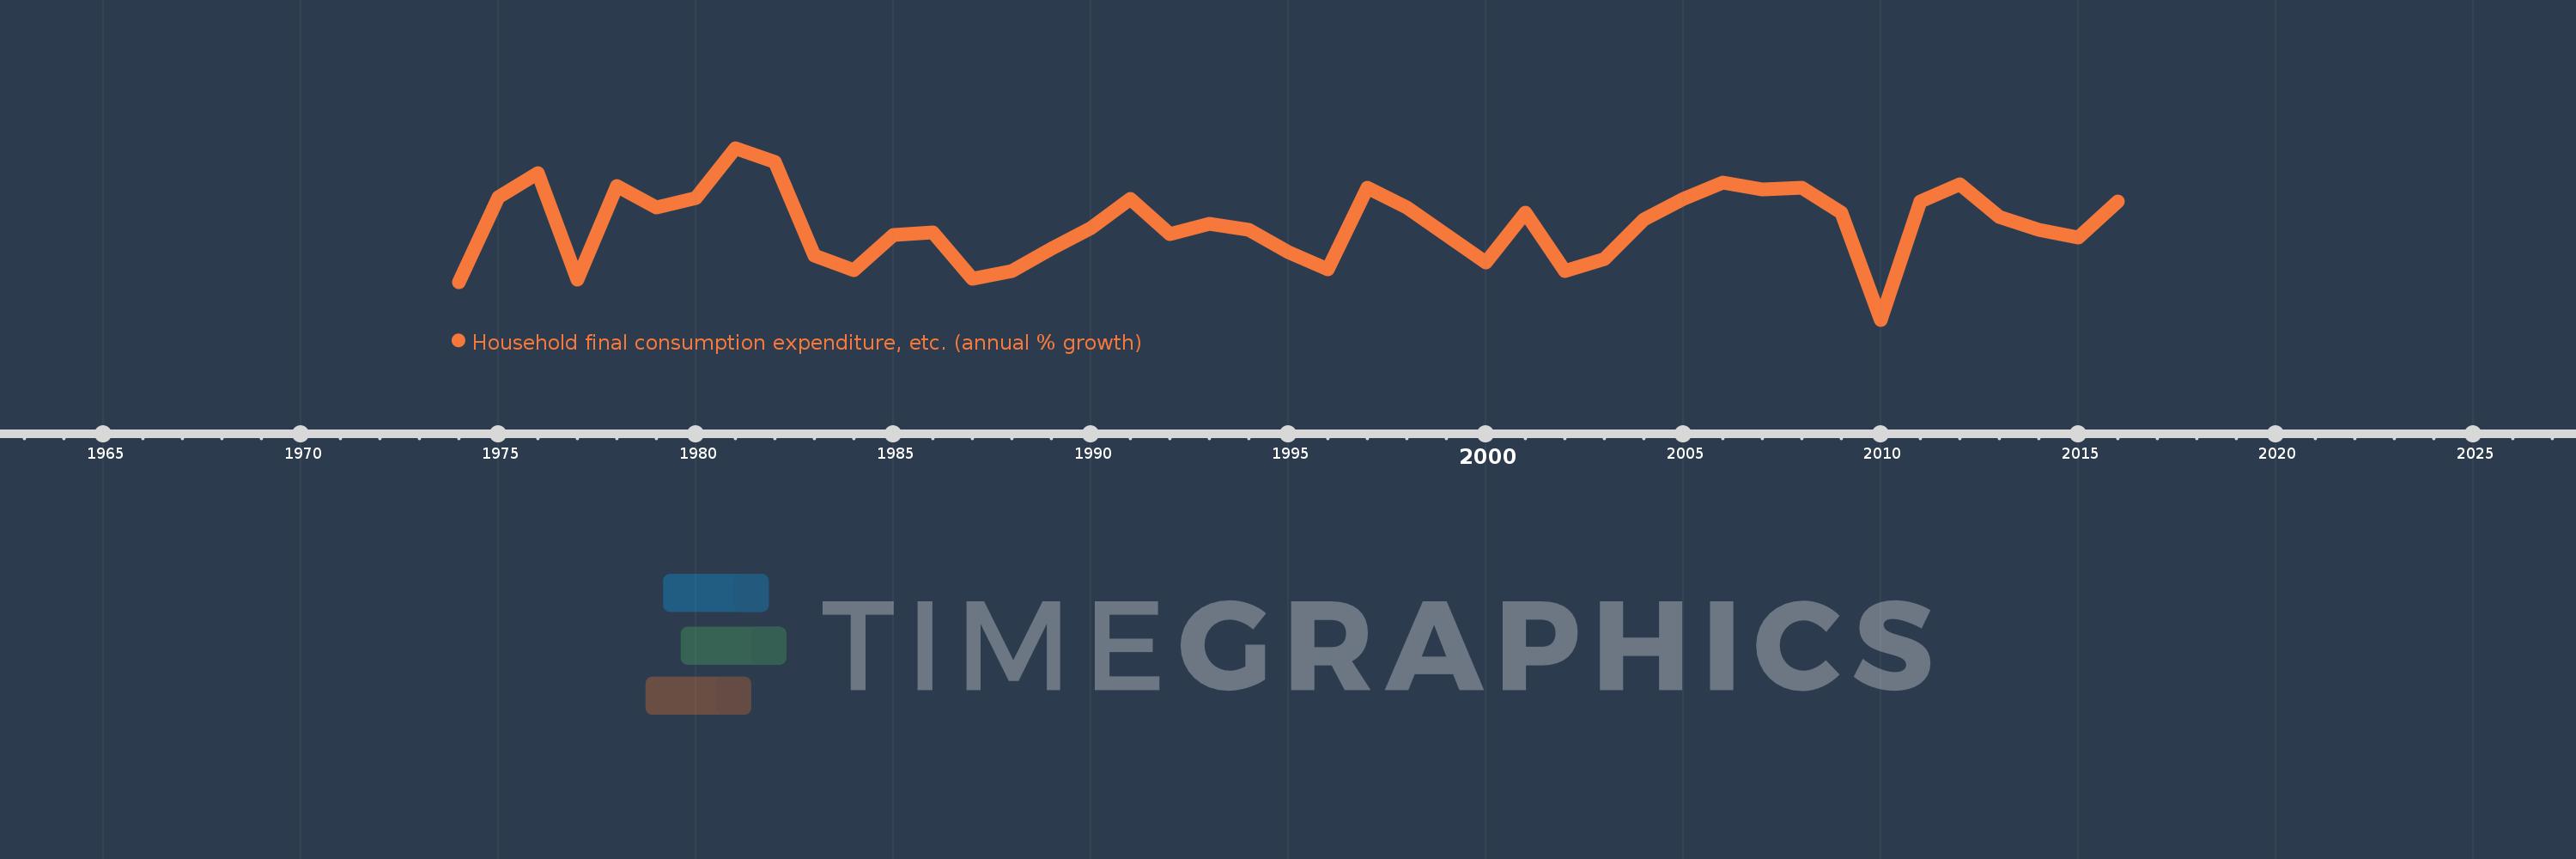
Household final consumption expenditure, etc. (annual % growth)
2016,2015,2014,2013,2012,2011,2010,2009,2008,2007,2006,2005,2004,2003,2002,2001,2000,1999,1998,1997,1996,1995,1994,1993,1992,1991,1990,1989,1988,1987,1986,1985,1984,1983,1982,1981,1980,1979,1978,1977,1976,1975,1974
This statistics in other country:
AlbaniaAlgeriaAntigua and BarbudaArab WorldArgentinaArmeniaAustraliaAustriaAzerbaijanBahamas, TheBahrainBangladeshBarbadosBelarusBelgiumBelizeBeninBhutanBoliviaBosnia and HerzegovinaBotswanaBrazilBrunei DarussalamBulgariaBurkina FasoBurundiCabo VerdeCambodiaCameroonCanadaCaribbean small statesCentral Europe and the BalticsChadChileColombiaComorosCongo, Dem. Rep.Congo, Rep.Costa RicaCote d'IvoireCroatiaCubaCyprusCzech RepublicDenmarkDjiboutiDominican RepublicEarly-demographic dividendEast Asia & PacificEcuadorEgypt, Arab Rep.El SalvadorEquatorial GuineaEritreaEstoniaEthiopiaEuro areaEurope & Central AsiaEurope & Central Asia (excluding high income)Europe & Central Asia (IDA & IBRD countries)European UnionFijiFinlandFranceGabonGambia, TheGeorgiaGermanyGhanaGreeceGuatemalaGuineaGuinea-BissauHaitiHeavily indebted poor countries (HIPC)High incomeHondurasHong Kong SAR, ChinaHungaryIBRD onlyIcelandIDA & IBRD totalIDA blendIDA onlyIDA totalIndiaIndonesiaIran, Islamic Rep.IrelandIsraelItalyJamaicaJapanJordanKazakhstanKenyaKorea, Rep.KosovoKuwaitKyrgyz RepublicLao PDRLatin America & Caribbean Latin America & Caribbean (excluding high income)Latin America & the Caribbean (IDA & IBRD countries)LatviaLeast developed countries: UN classificationLebanonLiberiaLithuaniaLow & middle incomeLow incomeLower middle incomeLuxembourgMacao SAR, ChinaMacedonia, FYRMadagascarMalawiMalaysiaMaliMaltaMarshall IslandsMauritaniaMauritiusMexicoMiddle East & North AfricaMiddle East & North Africa (excluding high income)Middle East & North Africa (IDA & IBRD countries)Middle incomeMoldovaMongoliaMontenegroMoroccoMozambiqueNamibiaNepalNetherlandsNew ZealandNicaraguaNigerNigeriaNorth AmericaNorwayOECD membersOmanOther small statesPakistanPanamaPapua New GuineaParaguayPeruPhilippinesPolandPortugalPost-demographic dividendPre-demographic dividendPuerto RicoQatarRomaniaRussian FederationRwandaSaudi ArabiaSenegalSerbiaSeychellesSierra LeoneSingaporeSlovak RepublicSloveniaSmall statesSomaliaSouth AfricaSouth AsiaSouth Asia (IDA & IBRD)South SudanSpainSri LankaSub-Saharan Africa Sub-Saharan Africa (excluding high income)Sub-Saharan Africa (IDA & IBRD countries)SudanSurinameSwazilandSwedenSwitzerlandSyrian Arab RepublicTajikistanTanzaniaThailandTimor-LesteTogoTrinidad and TobagoTunisiaTurkeyTurkmenistanUgandaUkraineUnited Arab EmiratesUnited KingdomUnited StatesUpper middle incomeUruguayVanuatuVenezuela, RBVietnamWest Bank and GazaWorldZambiaZimbabwe Timeline:
This timeline shows a graph from 1974 to 2016 of Early-demographic dividend. No data until 1973. Number of actual observations by date: 43.
Source name:
World Development Indicators
Source organization:
World Bank national accounts data, and OECD National Accounts data files.
Categories, topics:
Economy & Growth
Last updated:
apr 23, 2017
Indicators value changes by year
Minimum:
-1.932
jan 1, 2010
At the date of observation
Value
Absolute change
Change from previous value
jan 1, 1974
0.426
+0.426
0.0%
jan 1, 1975
5.756
+5.33
1.25K%
jan 1, 1976
7.274
+1.518
26.37%
jan 1, 1977
0.59
-6.684
-91.89%
jan 1, 1978
6.453
+5.862
993.21%
jan 1, 1979
5.105
-1.347
-20.88%
jan 1, 1980
5.688
+0.583
11.41%
jan 1, 1981
8.838
+3.15
55.38%
jan 1, 1982
7.98
-0.858
-9.7%
jan 1, 1983
2.095
-5.885
-73.75%
jan 1, 1984
1.178
-0.917
-43.76%
jan 1, 1985
3.364
+2.185
185.45%
jan 1, 1986
3.563
+0.199
5.92%
jan 1, 1987
0.62
-2.943
-82.6%
jan 1, 1988
1.098
+0.478
77.08%
jan 1, 1989
2.546
+1.448
131.88%
jan 1, 1990
3.821
+1.275
50.1%
jan 1, 1991
5.637
+1.816
47.52%
jan 1, 1992
3.439
-2.198
-38.99%
jan 1, 1993
4.082
+0.643
18.71%
jan 1, 1994
3.722
-0.36
-8.82%
jan 1, 1995
2.284
-1.438
-38.64%
jan 1, 1996
1.226
-1.058
-46.32%
jan 1, 1997
6.37
+5.144
419.53%
jan 1, 1998
5.104
-1.265
-19.86%
jan 1, 1999
3.369
-1.736
-34.01%
jan 1, 2000
1.684
-1.684
-50.0%
jan 1, 2001
4.766
+3.081
182.91%
jan 1, 2002
1.105
-3.66
-76.81%
jan 1, 2003
1.902
+0.797
72.14%
jan 1, 2004
4.362
+2.46
129.31%
jan 1, 2005
5.653
+1.291
29.6%
jan 1, 2006
6.664
+1.011
17.88%
jan 1, 2007
6.251
-0.413
-6.19%
jan 1, 2008
6.343
+0.092
1.47%
jan 1, 2009
4.761
-1.582
-24.94%
jan 1, 2010
-1.932
-6.693
-140.57%
jan 1, 2011
5.494
+7.426
-384.4%
jan 1, 2012
6.576
+1.082
19.7%
jan 1, 2013
4.532
-2.044
-31.09%
jan 1, 2014
3.712
-0.82
-18.1%
jan 1, 2015
3.213
-0.499
-13.43%
jan 1, 2016
5.464
+2.251
70.05%
Ranking of countries by current statistics by years


Comments: