29
/
en
AIzaSyAYiBZKx7MnpbEhh9jyipgxe19OcubqV5w
April 1, 2024
247646
Spain
ESP
true
2
1
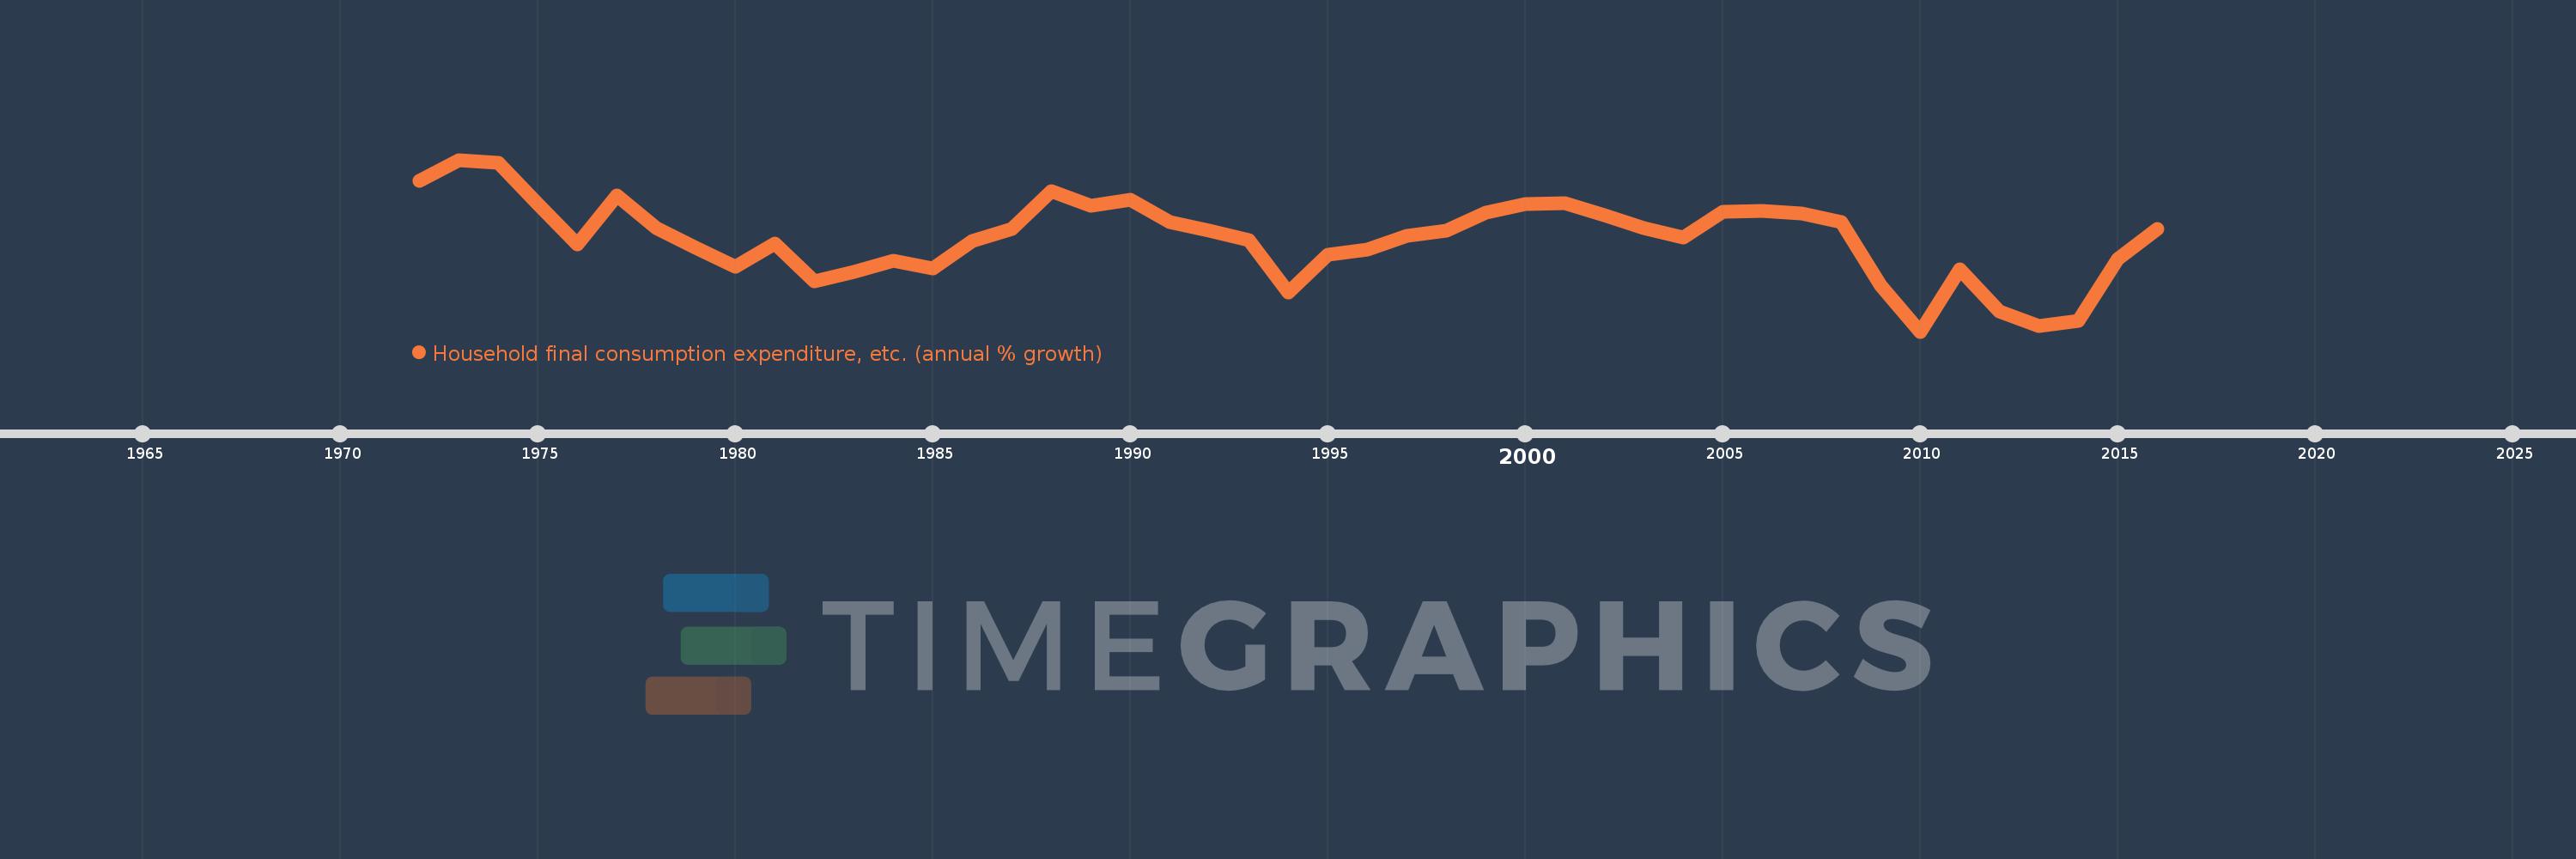
Household final consumption expenditure, etc. (annual % growth)
2016,2015,2014,2013,2012,2011,2010,2009,2008,2007,2006,2005,2004,2003,2002,2001,2000,1999,1998,1997,1996,1995,1994,1993,1992,1991,1990,1989,1988,1987,1986,1985,1984,1983,1982,1981,1980,1979,1978,1977,1976,1975,1974,1973,1972
This statistics in other country:
AlbaniaAlgeriaAntigua and BarbudaArab WorldArgentinaArmeniaAustraliaAustriaAzerbaijanBahamas, TheBahrainBangladeshBarbadosBelarusBelgiumBelizeBeninBhutanBoliviaBosnia and HerzegovinaBotswanaBrazilBrunei DarussalamBulgariaBurkina FasoBurundiCabo VerdeCambodiaCameroonCanadaCaribbean small statesCentral Europe and the BalticsChadChileColombiaComorosCongo, Dem. Rep.Congo, Rep.Costa RicaCote d'IvoireCroatiaCubaCyprusCzech RepublicDenmarkDjiboutiDominican RepublicEarly-demographic dividendEast Asia & PacificEcuadorEgypt, Arab Rep.El SalvadorEquatorial GuineaEritreaEstoniaEthiopiaEuro areaEurope & Central AsiaEurope & Central Asia (excluding high income)Europe & Central Asia (IDA & IBRD countries)European UnionFijiFinlandFranceGabonGambia, TheGeorgiaGermanyGhanaGreeceGuatemalaGuineaGuinea-BissauHaitiHeavily indebted poor countries (HIPC)High incomeHondurasHong Kong SAR, ChinaHungaryIBRD onlyIcelandIDA & IBRD totalIDA blendIDA onlyIDA totalIndiaIndonesiaIran, Islamic Rep.IrelandIsraelItalyJamaicaJapanJordanKazakhstanKenyaKorea, Rep.KosovoKuwaitKyrgyz RepublicLao PDRLatin America & Caribbean Latin America & Caribbean (excluding high income)Latin America & the Caribbean (IDA & IBRD countries)LatviaLeast developed countries: UN classificationLebanonLiberiaLithuaniaLow & middle incomeLow incomeLower middle incomeLuxembourgMacao SAR, ChinaMacedonia, FYRMadagascarMalawiMalaysiaMaliMaltaMarshall IslandsMauritaniaMauritiusMexicoMiddle East & North AfricaMiddle East & North Africa (excluding high income)Middle East & North Africa (IDA & IBRD countries)Middle incomeMoldovaMongoliaMontenegroMoroccoMozambiqueNamibiaNepalNetherlandsNew ZealandNicaraguaNigerNigeriaNorth AmericaNorwayOECD membersOmanOther small statesPakistanPanamaPapua New GuineaParaguayPeruPhilippinesPolandPortugalPost-demographic dividendPre-demographic dividendPuerto RicoQatarRomaniaRussian FederationRwandaSaudi ArabiaSenegalSerbiaSeychellesSierra LeoneSingaporeSlovak RepublicSloveniaSmall statesSomaliaSouth AfricaSouth AsiaSouth Asia (IDA & IBRD)South SudanSpainSri LankaSub-Saharan Africa Sub-Saharan Africa (excluding high income)Sub-Saharan Africa (IDA & IBRD countries)SudanSurinameSwazilandSwedenSwitzerlandSyrian Arab RepublicTajikistanTanzaniaThailandTimor-LesteTogoTrinidad and TobagoTunisiaTurkeyTurkmenistanUgandaUkraineUnited Arab EmiratesUnited KingdomUnited StatesUpper middle incomeUruguayVanuatuVenezuela, RBVietnamWest Bank and GazaWorldZambiaZimbabwe Timeline:
This timeline shows a graph from 1972 to 2016 of Spain. No data until 1971. Number of actual observations by date: 45.
Source name:
World Development Indicators
Source organization:
World Bank national accounts data, and OECD National Accounts data files.
Categories, topics:
Economy & Growth
Last updated:
apr 23, 2017
Indicators value changes by year
Minimum:
-3.663
jan 1, 2010
At the date of observation
Value
Absolute change
Change from previous value
jan 1, 1972
5.926
+5.926
0.0%
jan 1, 1973
7.247
+1.321
22.29%
jan 1, 1974
7.068
-0.179
-2.48%
jan 1, 1975
4.42
-2.648
-37.46%
jan 1, 1976
1.858
-2.563
-57.98%
jan 1, 1977
4.957
+3.1
166.86%
jan 1, 1978
2.913
-2.044
-41.23%
jan 1, 1979
1.654
-1.26
-43.24%
jan 1, 1980
0.446
-1.207
-73.02%
jan 1, 1981
1.942
+1.496
335.23%
jan 1, 1982
-0.471
-2.413
-124.23%
jan 1, 1983
0.148
+0.619
-131.49%
jan 1, 1984
0.815
+0.666
449.81%
jan 1, 1985
0.346
-0.468
-57.49%
jan 1, 1986
2.083
+1.737
501.47%
jan 1, 1987
2.839
+0.756
36.29%
jan 1, 1988
5.28
+2.441
85.99%
jan 1, 1989
4.334
-0.947
-17.93%
jan 1, 1990
4.71
+0.376
8.68%
jan 1, 1991
3.272
-1.438
-30.54%
jan 1, 1992
2.731
-0.541
-16.53%
jan 1, 1993
2.141
-0.59
-21.62%
jan 1, 1994
-1.155
-3.296
-153.97%
jan 1, 1995
1.198
+2.353
-203.69%
jan 1, 1996
1.521
+0.323
27.0%
jan 1, 1997
2.438
+0.916
60.22%
jan 1, 1998
2.728
+0.291
11.93%
jan 1, 1999
3.865
+1.137
41.68%
jan 1, 2000
4.413
+0.547
14.16%
jan 1, 2001
4.506
+0.093
2.12%
jan 1, 2002
3.755
-0.751
-16.67%
jan 1, 2003
2.897
-0.858
-22.84%
jan 1, 2004
2.31
-0.587
-20.27%
jan 1, 2005
3.94
+1.63
70.57%
jan 1, 2006
4.011
+0.07
1.79%
jan 1, 2007
3.856
-0.154
-3.85%
jan 1, 2008
3.265
-0.591
-15.32%
jan 1, 2009
-0.751
-4.016
-122.99%
jan 1, 2010
-3.663
-2.912
387.93%
jan 1, 2011
0.294
+3.957
-108.03%
jan 1, 2012
-2.354
-2.648
-900.57%
jan 1, 2013
-3.286
-0.932
39.6%
jan 1, 2014
-2.972
+0.314
-9.55%
jan 1, 2015
0.948
+3.92
-131.88%
jan 1, 2016
2.853
+1.905
201.02%
Ranking of countries by current statistics by years


Comments: