29
/
en
AIzaSyAYiBZKx7MnpbEhh9jyipgxe19OcubqV5w
April 1, 2024
91248
Brazil
BRA
true
2
1
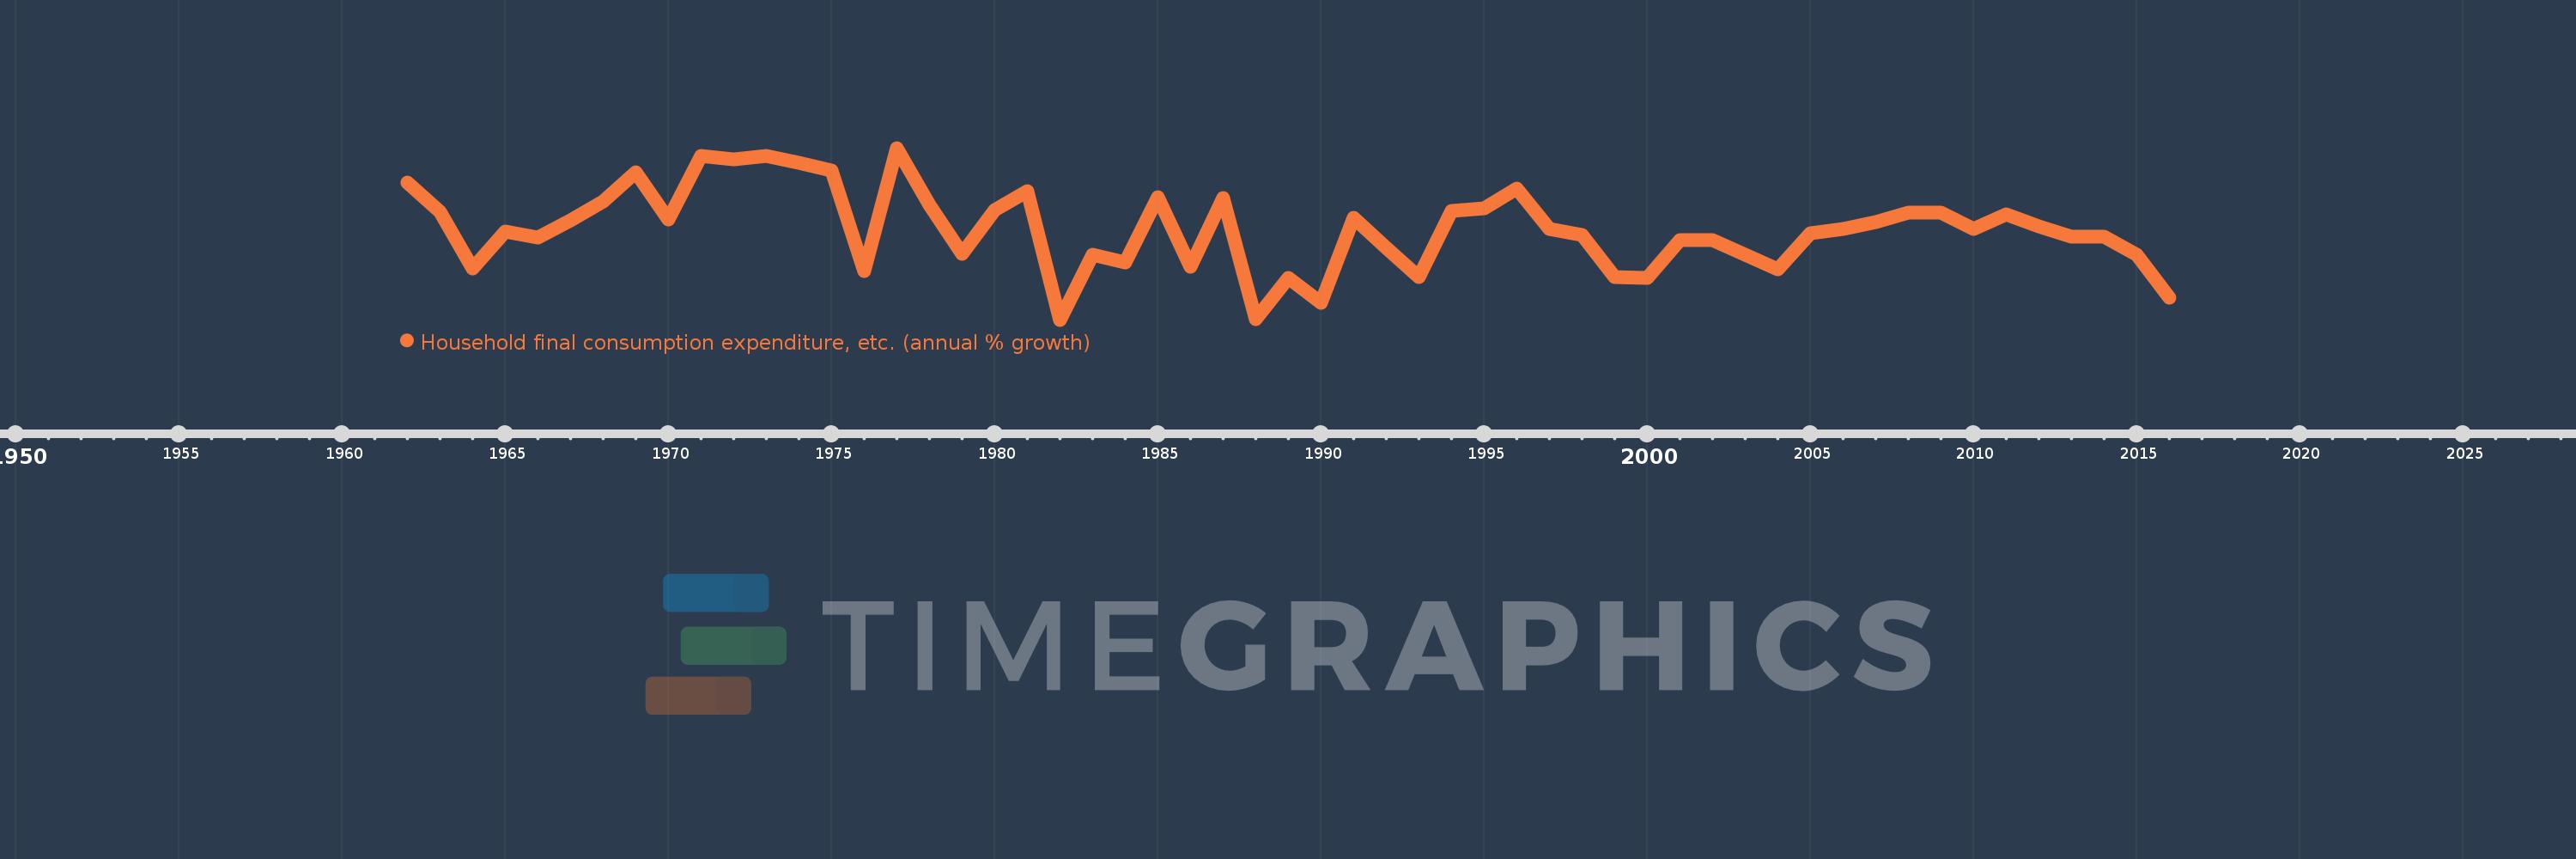
Household final consumption expenditure, etc. (annual % growth)
2016,2015,2014,2013,2012,2011,2010,2009,2008,2007,2006,2005,2004,2003,2002,2001,2000,1999,1998,1997,1996,1995,1994,1993,1992,1991,1990,1989,1988,1987,1986,1985,1984,1983,1982,1981,1980,1979,1978,1977,1976,1975,1974,1973,1972,1971,1970,1969,1968,1967,1966,1965,1964,1963,1962
This statistics in other country:
AlbaniaAlgeriaAntigua and BarbudaArab WorldArgentinaArmeniaAustraliaAustriaAzerbaijanBahamas, TheBahrainBangladeshBarbadosBelarusBelgiumBelizeBeninBhutanBoliviaBosnia and HerzegovinaBotswanaBrazilBrunei DarussalamBulgariaBurkina FasoBurundiCabo VerdeCambodiaCameroonCanadaCaribbean small statesCentral Europe and the BalticsChadChileColombiaComorosCongo, Dem. Rep.Congo, Rep.Costa RicaCote d'IvoireCroatiaCubaCyprusCzech RepublicDenmarkDjiboutiDominican RepublicEarly-demographic dividendEast Asia & PacificEcuadorEgypt, Arab Rep.El SalvadorEquatorial GuineaEritreaEstoniaEthiopiaEuro areaEurope & Central AsiaEurope & Central Asia (excluding high income)Europe & Central Asia (IDA & IBRD countries)European UnionFijiFinlandFranceGabonGambia, TheGeorgiaGermanyGhanaGreeceGuatemalaGuineaGuinea-BissauHaitiHeavily indebted poor countries (HIPC)High incomeHondurasHong Kong SAR, ChinaHungaryIBRD onlyIcelandIDA & IBRD totalIDA blendIDA onlyIDA totalIndiaIndonesiaIran, Islamic Rep.IrelandIsraelItalyJamaicaJapanJordanKazakhstanKenyaKorea, Rep.KosovoKuwaitKyrgyz RepublicLao PDRLatin America & Caribbean Latin America & Caribbean (excluding high income)Latin America & the Caribbean (IDA & IBRD countries)LatviaLeast developed countries: UN classificationLebanonLiberiaLithuaniaLow & middle incomeLow incomeLower middle incomeLuxembourgMacao SAR, ChinaMacedonia, FYRMadagascarMalawiMalaysiaMaliMaltaMarshall IslandsMauritaniaMauritiusMexicoMiddle East & North AfricaMiddle East & North Africa (excluding high income)Middle East & North Africa (IDA & IBRD countries)Middle incomeMoldovaMongoliaMontenegroMoroccoMozambiqueNamibiaNepalNetherlandsNew ZealandNicaraguaNigerNigeriaNorth AmericaNorwayOECD membersOmanOther small statesPakistanPanamaPapua New GuineaParaguayPeruPhilippinesPolandPortugalPost-demographic dividendPre-demographic dividendPuerto RicoQatarRomaniaRussian FederationRwandaSaudi ArabiaSenegalSerbiaSeychellesSierra LeoneSingaporeSlovak RepublicSloveniaSmall statesSomaliaSouth AfricaSouth AsiaSouth Asia (IDA & IBRD)South SudanSpainSri LankaSub-Saharan Africa Sub-Saharan Africa (excluding high income)Sub-Saharan Africa (IDA & IBRD countries)SudanSurinameSwazilandSwedenSwitzerlandSyrian Arab RepublicTajikistanTanzaniaThailandTimor-LesteTogoTrinidad and TobagoTunisiaTurkeyTurkmenistanUgandaUkraineUnited Arab EmiratesUnited KingdomUnited StatesUpper middle incomeUruguayVanuatuVenezuela, RBVietnamWest Bank and GazaWorldZambiaZimbabwe Timeline:
This timeline shows a graph from 1962 to 2016 of Brazil. No data until 1961. Number of actual observations by date: 55.
Source name:
World Development Indicators
Source organization:
World Bank national accounts data, and OECD National Accounts data files.
Categories, topics:
Economy & Growth
Last updated:
apr 23, 2017
Indicators value changes by year
At the date of observation
Value
Absolute change
Change from previous value
jan 1, 1962
10.074
+10.074
0.0%
jan 1, 1963
6.508
-3.567
-35.4%
jan 1, 1964
-0.38
-6.888
-105.84%
jan 1, 1965
4.129
+4.509
-1.19K%
jan 1, 1966
3.364
-0.765
-18.52%
jan 1, 1967
5.522
+2.157
64.13%
jan 1, 1968
7.801
+2.279
41.27%
jan 1, 1969
11.361
+3.56
45.64%
jan 1, 1970
5.606
-5.755
-50.66%
jan 1, 1971
13.372
+7.766
138.54%
jan 1, 1972
12.873
-0.499
-3.73%
jan 1, 1973
13.309
+0.437
3.39%
jan 1, 1974
12.483
-0.826
-6.21%
jan 1, 1975
11.556
-0.928
-7.43%
jan 1, 1976
-0.683
-12.239
-105.91%
jan 1, 1977
14.3
+14.983
-2.19K%
jan 1, 1978
7.347
-6.953
-48.62%
jan 1, 1979
1.357
-5.99
-81.53%
jan 1, 1980
6.708
+5.351
394.28%
jan 1, 1981
9.023
+2.315
34.5%
jan 1, 1982
-6.64
-15.663
-173.59%
jan 1, 1983
1.306
+7.946
-119.66%
jan 1, 1984
0.391
-0.915
-70.08%
jan 1, 1985
8.26
+7.869
2.01K%
jan 1, 1986
-0.231
-8.491
-102.8%
jan 1, 1987
8.226
+8.457
-3.66K%
jan 1, 1988
-6.615
-14.841
-180.41%
jan 1, 1989
-1.563
+5.052
-76.37%
jan 1, 1990
-4.582
-3.019
193.17%
jan 1, 1991
5.762
+10.344
-225.75%
jan 1, 1992
2.104
-3.657
-63.48%
jan 1, 1993
-1.389
-3.494
-166.02%
jan 1, 1994
6.586
+7.975
-574.07%
jan 1, 1995
6.972
+0.386
5.86%
jan 1, 1996
9.356
+2.384
34.19%
jan 1, 1997
4.466
-4.891
-52.27%
jan 1, 1998
3.692
-0.774
-17.33%
jan 1, 1999
-1.389
-5.08
-137.62%
jan 1, 2000
-1.588
-0.199
14.36%
jan 1, 2001
3.058
+4.646
-292.53%
jan 1, 2002
3.016
-0.042
-1.38%
jan 1, 2003
1.318
-1.697
-56.28%
jan 1, 2004
-0.546
-1.865
-141.43%
jan 1, 2005
3.922
+4.469
-818.07%
jan 1, 2006
4.423
+0.501
12.77%
jan 1, 2007
5.285
+0.862
19.49%
jan 1, 2008
6.374
+1.089
20.6%
jan 1, 2009
6.466
+0.092
1.44%
jan 1, 2010
4.455
-2.011
-31.1%
jan 1, 2011
6.232
+1.777
39.89%
jan 1, 2012
4.739
-1.493
-23.95%
jan 1, 2013
3.504
-1.236
-26.08%
jan 1, 2014
3.477
-0.027
-0.77%
jan 1, 2015
1.321
-2.156
-62.01%
jan 1, 2016
-3.997
-5.318
-402.62%
Ranking of countries by current statistics by years


Comments: