29
/
en
AIzaSyAYiBZKx7MnpbEhh9jyipgxe19OcubqV5w
April 1, 2024
272343
Uganda
UGA
true
2
1
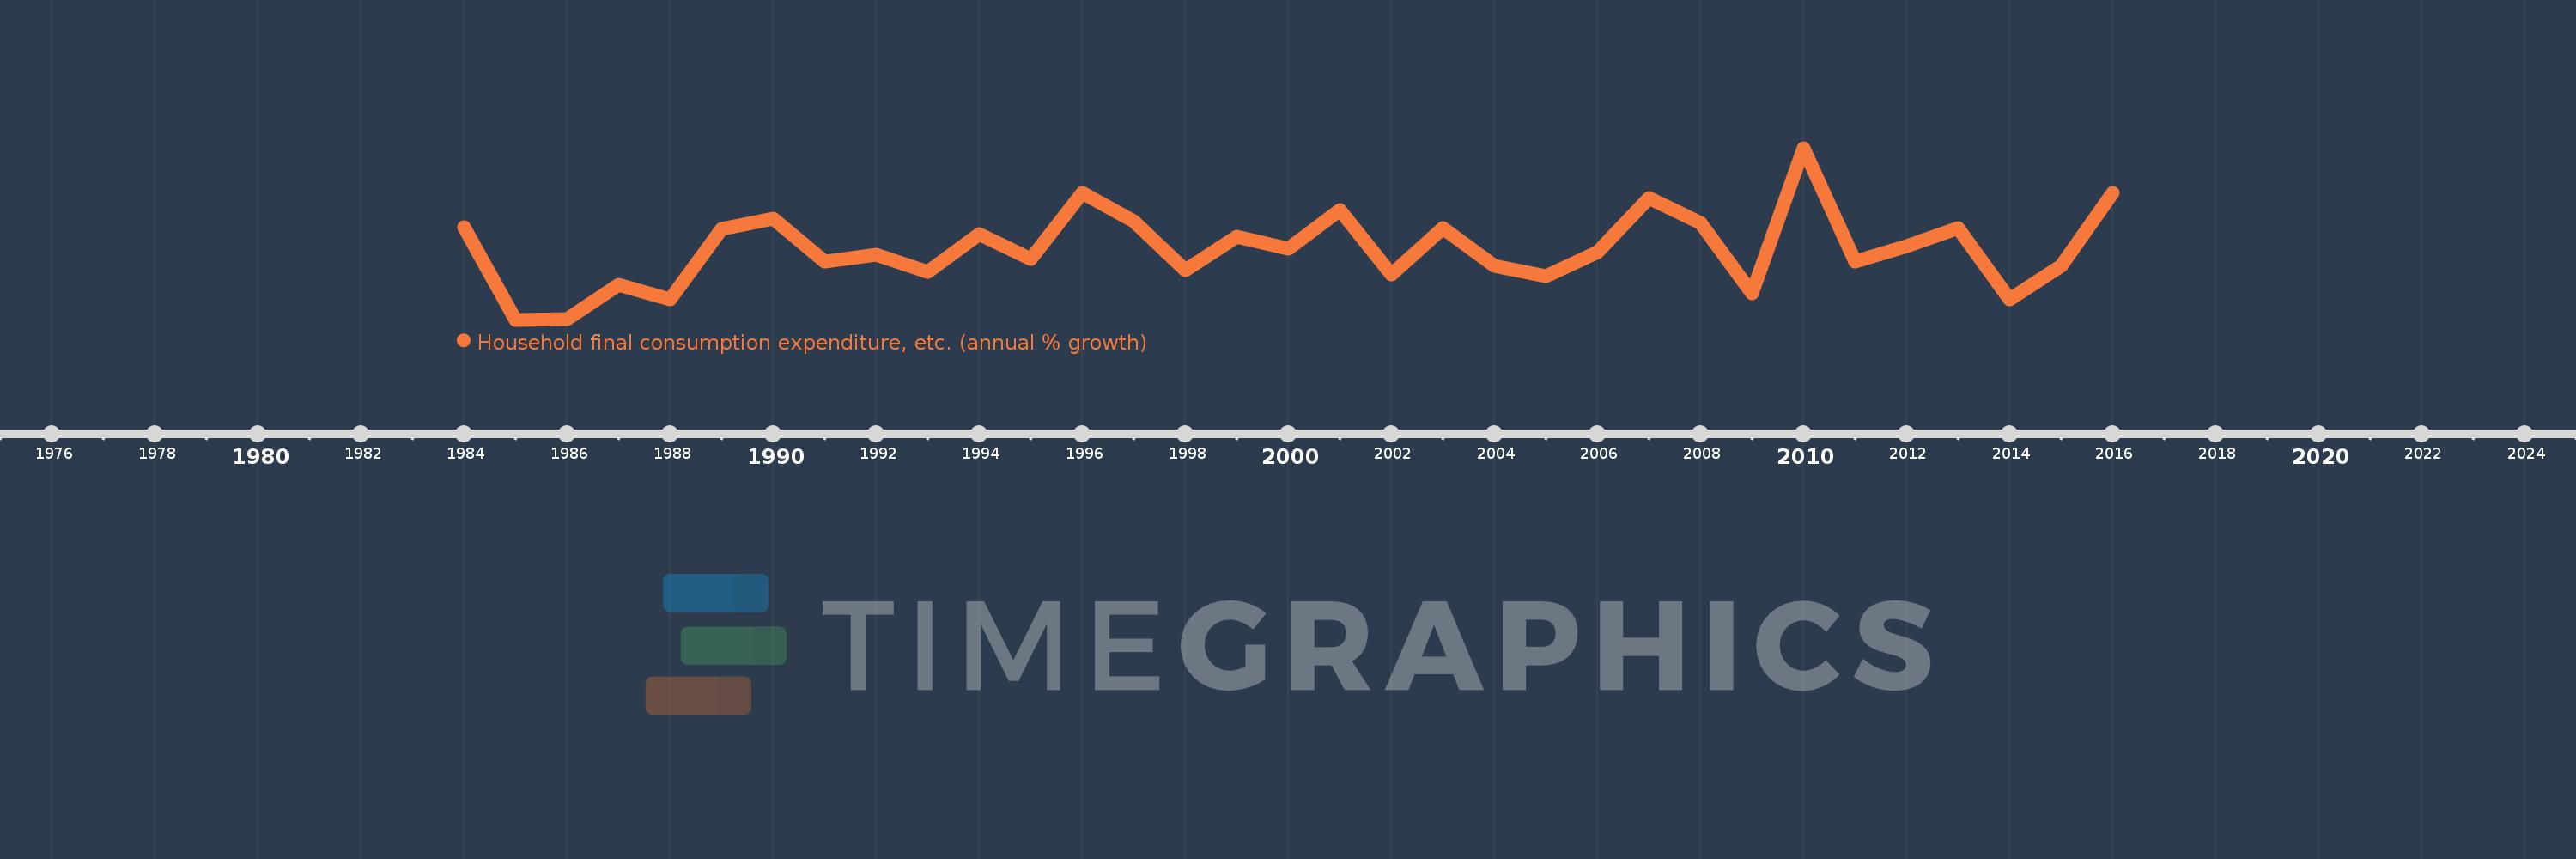
Household final consumption expenditure, etc. (annual % growth)
2016,2015,2014,2013,2012,2011,2010,2009,2008,2007,2006,2005,2004,2003,2002,2001,2000,1999,1998,1997,1996,1995,1994,1993,1992,1991,1990,1989,1988,1987,1986,1985,1984
This statistics in other country:
AlbaniaAlgeriaAntigua and BarbudaArab WorldArgentinaArmeniaAustraliaAustriaAzerbaijanBahamas, TheBahrainBangladeshBarbadosBelarusBelgiumBelizeBeninBhutanBoliviaBosnia and HerzegovinaBotswanaBrazilBrunei DarussalamBulgariaBurkina FasoBurundiCabo VerdeCambodiaCameroonCanadaCaribbean small statesCentral Europe and the BalticsChadChileColombiaComorosCongo, Dem. Rep.Congo, Rep.Costa RicaCote d'IvoireCroatiaCubaCyprusCzech RepublicDenmarkDjiboutiDominican RepublicEarly-demographic dividendEast Asia & PacificEcuadorEgypt, Arab Rep.El SalvadorEquatorial GuineaEritreaEstoniaEthiopiaEuro areaEurope & Central AsiaEurope & Central Asia (excluding high income)Europe & Central Asia (IDA & IBRD countries)European UnionFijiFinlandFranceGabonGambia, TheGeorgiaGermanyGhanaGreeceGuatemalaGuineaGuinea-BissauHaitiHeavily indebted poor countries (HIPC)High incomeHondurasHong Kong SAR, ChinaHungaryIBRD onlyIcelandIDA & IBRD totalIDA blendIDA onlyIDA totalIndiaIndonesiaIran, Islamic Rep.IrelandIsraelItalyJamaicaJapanJordanKazakhstanKenyaKorea, Rep.KosovoKuwaitKyrgyz RepublicLao PDRLatin America & Caribbean Latin America & Caribbean (excluding high income)Latin America & the Caribbean (IDA & IBRD countries)LatviaLeast developed countries: UN classificationLebanonLiberiaLithuaniaLow & middle incomeLow incomeLower middle incomeLuxembourgMacao SAR, ChinaMacedonia, FYRMadagascarMalawiMalaysiaMaliMaltaMarshall IslandsMauritaniaMauritiusMexicoMiddle East & North AfricaMiddle East & North Africa (excluding high income)Middle East & North Africa (IDA & IBRD countries)Middle incomeMoldovaMongoliaMontenegroMoroccoMozambiqueNamibiaNepalNetherlandsNew ZealandNicaraguaNigerNigeriaNorth AmericaNorwayOECD membersOmanOther small statesPakistanPanamaPapua New GuineaParaguayPeruPhilippinesPolandPortugalPost-demographic dividendPre-demographic dividendPuerto RicoQatarRomaniaRussian FederationRwandaSaudi ArabiaSenegalSerbiaSeychellesSierra LeoneSingaporeSlovak RepublicSloveniaSmall statesSomaliaSouth AfricaSouth AsiaSouth Asia (IDA & IBRD)South SudanSpainSri LankaSub-Saharan Africa Sub-Saharan Africa (excluding high income)Sub-Saharan Africa (IDA & IBRD countries)SudanSurinameSwazilandSwedenSwitzerlandSyrian Arab RepublicTajikistanTanzaniaThailandTimor-LesteTogoTrinidad and TobagoTunisiaTurkeyTurkmenistanUgandaUkraineUnited Arab EmiratesUnited KingdomUnited StatesUpper middle incomeUruguayVanuatuVenezuela, RBVietnamWest Bank and GazaWorldZambiaZimbabwe Timeline:
This timeline shows a graph from 1984 to 2016 of Uganda. No data until 1983. Number of actual observations by date: 33.
Source name:
World Development Indicators
Source organization:
World Bank national accounts data, and OECD National Accounts data files.
Categories, topics:
Economy & Growth
Last updated:
apr 23, 2017
Indicators value changes by year
Minimum:
-2.986
jan 1, 1985
Maximum:
18.123
jan 1, 2010
At the date of observation
Value
Absolute change
Change from previous value
jan 1, 1984
8.417
+8.417
0.0%
jan 1, 1985
-2.986
-11.403
-135.47%
jan 1, 1986
-2.917
+0.069
-2.3%
jan 1, 1987
1.335
+4.253
-145.78%
jan 1, 1988
-0.465
-1.8
-134.82%
jan 1, 1989
8.17
+8.636
-1.86K%
jan 1, 1990
9.391
+1.22
14.94%
jan 1, 1991
4.147
-5.244
-55.84%
jan 1, 1992
4.995
+0.848
20.44%
jan 1, 1993
2.865
-2.13
-42.65%
jan 1, 1994
7.546
+4.681
163.43%
jan 1, 1995
4.459
-3.087
-40.91%
jan 1, 1996
12.634
+8.175
183.36%
jan 1, 1997
9.122
-3.511
-27.79%
jan 1, 1998
3.14
-5.983
-65.58%
jan 1, 1999
7.185
+4.045
128.82%
jan 1, 2000
5.71
-1.475
-20.53%
jan 1, 2001
10.451
+4.741
83.03%
jan 1, 2002
2.57
-7.881
-75.41%
jan 1, 2003
8.316
+5.746
223.61%
jan 1, 2004
3.668
-4.648
-55.89%
jan 1, 2005
2.377
-1.291
-35.2%
jan 1, 2006
5.279
+2.902
122.09%
jan 1, 2007
11.959
+6.679
126.52%
jan 1, 2008
8.947
-3.011
-25.18%
jan 1, 2009
0.297
-8.651
-96.69%
jan 1, 2010
18.123
+17.826
6.01K%
jan 1, 2011
4.108
-14.015
-77.33%
jan 1, 2012
6.046
+1.939
47.19%
jan 1, 2013
8.319
+2.273
37.59%
jan 1, 2014
-0.527
-8.847
-106.34%
jan 1, 2015
3.627
+4.155
-788.1%
jan 1, 2016
12.63
+9.003
248.18%
Ranking of countries by current statistics by years


Comments: