29
/
en
AIzaSyAYiBZKx7MnpbEhh9jyipgxe19OcubqV5w
April 1, 2024
264700
Togo
TGO
true
2
1
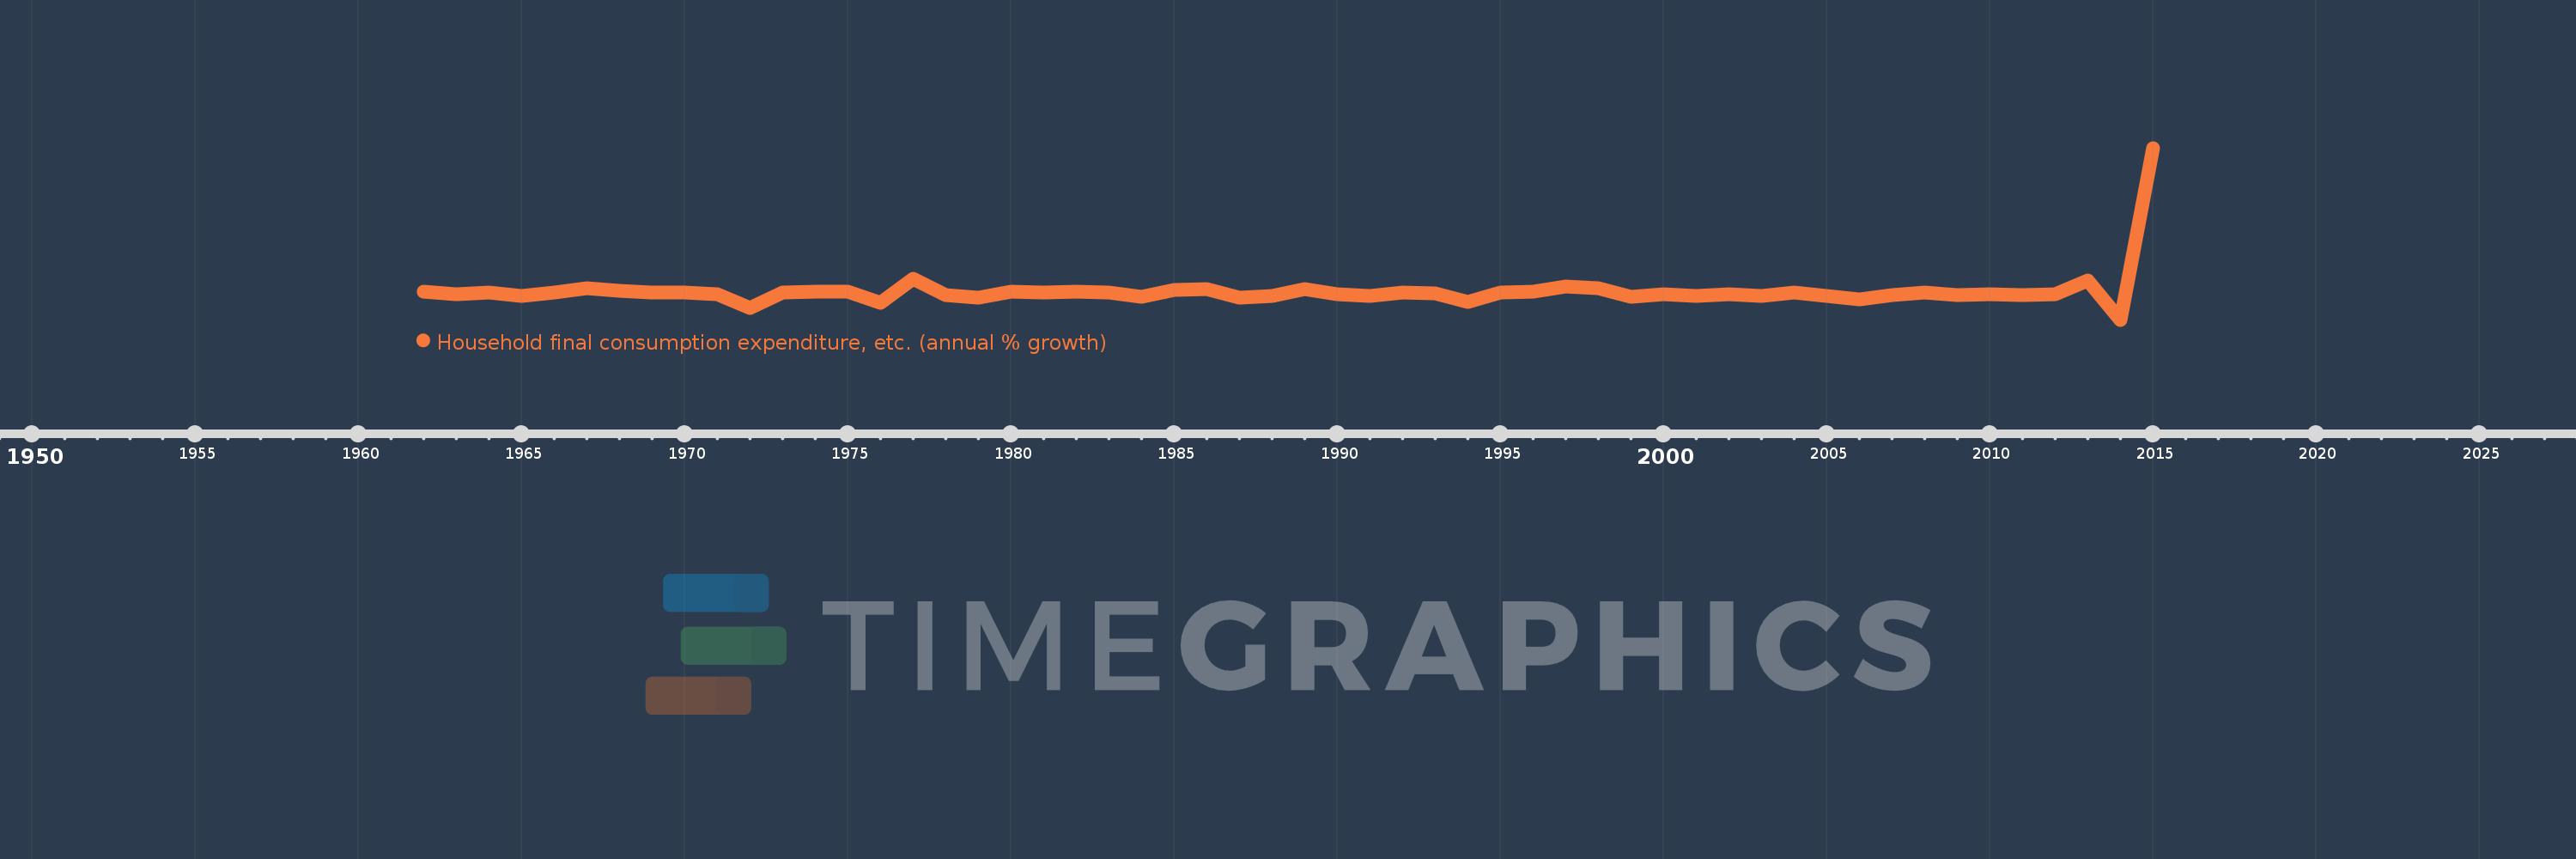
Household final consumption expenditure, etc. (annual % growth)
2015,2014,2013,2012,2011,2010,2009,2008,2007,2006,2005,2004,2003,2002,2001,2000,1999,1998,1997,1996,1995,1994,1993,1992,1991,1990,1989,1988,1987,1986,1985,1984,1983,1982,1981,1980,1979,1978,1977,1976,1975,1974,1973,1972,1971,1970,1969,1968,1967,1966,1965,1964,1963,1962
This statistics in other country:
AlbaniaAlgeriaAntigua and BarbudaArab WorldArgentinaArmeniaAustraliaAustriaAzerbaijanBahamas, TheBahrainBangladeshBarbadosBelarusBelgiumBelizeBeninBhutanBoliviaBosnia and HerzegovinaBotswanaBrazilBrunei DarussalamBulgariaBurkina FasoBurundiCabo VerdeCambodiaCameroonCanadaCaribbean small statesCentral Europe and the BalticsChadChileColombiaComorosCongo, Dem. Rep.Congo, Rep.Costa RicaCote d'IvoireCroatiaCubaCyprusCzech RepublicDenmarkDjiboutiDominican RepublicEarly-demographic dividendEast Asia & PacificEcuadorEgypt, Arab Rep.El SalvadorEquatorial GuineaEritreaEstoniaEthiopiaEuro areaEurope & Central AsiaEurope & Central Asia (excluding high income)Europe & Central Asia (IDA & IBRD countries)European UnionFijiFinlandFranceGabonGambia, TheGeorgiaGermanyGhanaGreeceGuatemalaGuineaGuinea-BissauHaitiHeavily indebted poor countries (HIPC)High incomeHondurasHong Kong SAR, ChinaHungaryIBRD onlyIcelandIDA & IBRD totalIDA blendIDA onlyIDA totalIndiaIndonesiaIran, Islamic Rep.IrelandIsraelItalyJamaicaJapanJordanKazakhstanKenyaKorea, Rep.KosovoKuwaitKyrgyz RepublicLao PDRLatin America & Caribbean Latin America & Caribbean (excluding high income)Latin America & the Caribbean (IDA & IBRD countries)LatviaLeast developed countries: UN classificationLebanonLiberiaLithuaniaLow & middle incomeLow incomeLower middle incomeLuxembourgMacao SAR, ChinaMacedonia, FYRMadagascarMalawiMalaysiaMaliMaltaMarshall IslandsMauritaniaMauritiusMexicoMiddle East & North AfricaMiddle East & North Africa (excluding high income)Middle East & North Africa (IDA & IBRD countries)Middle incomeMoldovaMongoliaMontenegroMoroccoMozambiqueNamibiaNepalNetherlandsNew ZealandNicaraguaNigerNigeriaNorth AmericaNorwayOECD membersOmanOther small statesPakistanPanamaPapua New GuineaParaguayPeruPhilippinesPolandPortugalPost-demographic dividendPre-demographic dividendPuerto RicoQatarRomaniaRussian FederationRwandaSaudi ArabiaSenegalSerbiaSeychellesSierra LeoneSingaporeSlovak RepublicSloveniaSmall statesSomaliaSouth AfricaSouth AsiaSouth Asia (IDA & IBRD)South SudanSpainSri LankaSub-Saharan Africa Sub-Saharan Africa (excluding high income)Sub-Saharan Africa (IDA & IBRD countries)SudanSurinameSwazilandSwedenSwitzerlandSyrian Arab RepublicTajikistanTanzaniaThailandTimor-LesteTogoTrinidad and TobagoTunisiaTurkeyTurkmenistanUgandaUkraineUnited Arab EmiratesUnited KingdomUnited StatesUpper middle incomeUruguayVanuatuVenezuela, RBVietnamWest Bank and GazaWorldZambiaZimbabwe Timeline:
This timeline shows a graph from 1962 to 2015 of Togo. No data until 1961. Number of actual observations by date: 54.
Source name:
World Development Indicators
Source organization:
World Bank national accounts data, and OECD National Accounts data files.
Categories, topics:
Economy & Growth
Last updated:
apr 23, 2017
Indicators value changes by year
Minimum:
-79.569
jan 1, 2014
Maximum:
471.384
jan 1, 2015
At the date of observation
Value
Absolute change
Change from previous value
jan 1, 1962
11.351
+11.351
0.0%
jan 1, 1963
1.565
-9.786
-86.21%
jan 1, 1964
6.846
+5.281
337.43%
jan 1, 1965
-4.047
-10.893
-159.12%
jan 1, 1966
7.181
+11.228
-277.43%
jan 1, 1967
20.466
+13.285
185.01%
jan 1, 1968
12.848
-7.618
-37.22%
jan 1, 1969
8.129
-4.719
-36.73%
jan 1, 1970
8.067
-0.062
-0.76%
jan 1, 1971
2.985
-5.081
-62.99%
jan 1, 1972
-42.24
-45.225
-1.51K%
jan 1, 1973
8.597
+50.837
-120.35%
jan 1, 1974
11.308
+2.71
31.52%
jan 1, 1975
11.043
-0.265
-2.34%
jan 1, 1976
-24.001
-35.044
-317.34%
jan 1, 1977
52.75
+76.751
-319.78%
jan 1, 1978
-0.485
-53.235
-100.92%
jan 1, 1979
-9.269
-8.785
1.81K%
jan 1, 1980
10.078
+19.347
-208.73%
jan 1, 1981
7.362
-2.716
-26.95%
jan 1, 1982
9.89
+2.528
34.34%
jan 1, 1983
7.7
-2.19
-22.14%
jan 1, 1984
-6.407
-14.107
-183.2%
jan 1, 1985
14.98
+21.387
-333.82%
jan 1, 1986
18.794
+3.814
25.46%
jan 1, 1987
-8.251
-27.044
-143.9%
jan 1, 1988
-4.566
+3.685
-44.66%
jan 1, 1989
18.975
+23.541
-515.61%
jan 1, 1990
1.997
-16.978
-89.48%
jan 1, 1991
-3.82
-5.817
-291.28%
jan 1, 1992
7.244
+11.064
-289.65%
jan 1, 1993
5.233
-2.011
-27.76%
jan 1, 1994
-23.043
-28.276
-540.32%
jan 1, 1995
6.724
+29.767
-129.18%
jan 1, 1996
10.005
+3.28
48.78%
jan 1, 1997
27.908
+17.903
178.95%
jan 1, 1998
21.576
-6.332
-22.69%
jan 1, 1999
-7.216
-28.792
-133.44%
jan 1, 2000
1.71
+8.926
-123.7%
jan 1, 2001
-2.339
-4.049
-236.78%
jan 1, 2002
3.474
+5.813
-248.5%
jan 1, 2003
-3.036
-6.509
-187.39%
jan 1, 2004
7.519
+10.555
-347.7%
jan 1, 2005
-3.936
-11.455
-152.35%
jan 1, 2006
-14.907
-10.971
278.72%
jan 1, 2007
-1.033
+13.874
-93.07%
jan 1, 2008
6.898
+7.93
-767.88%
jan 1, 2009
-1.326
-8.223
-119.22%
jan 1, 2010
2.504
+3.83
-288.85%
jan 1, 2011
-1.759
-4.263
-170.25%
jan 1, 2012
1.558
+3.317
-188.59%
jan 1, 2013
45.677
+44.118
2.83K%
jan 1, 2014
-79.569
-125.246
-274.2%
jan 1, 2015
471.384
+550.954
-692.42%
Ranking of countries by current statistics by years


Comments: