29
/
en
AIzaSyAYiBZKx7MnpbEhh9jyipgxe19OcubqV5w
April 1, 2024
154703
India
IND
true
2
1
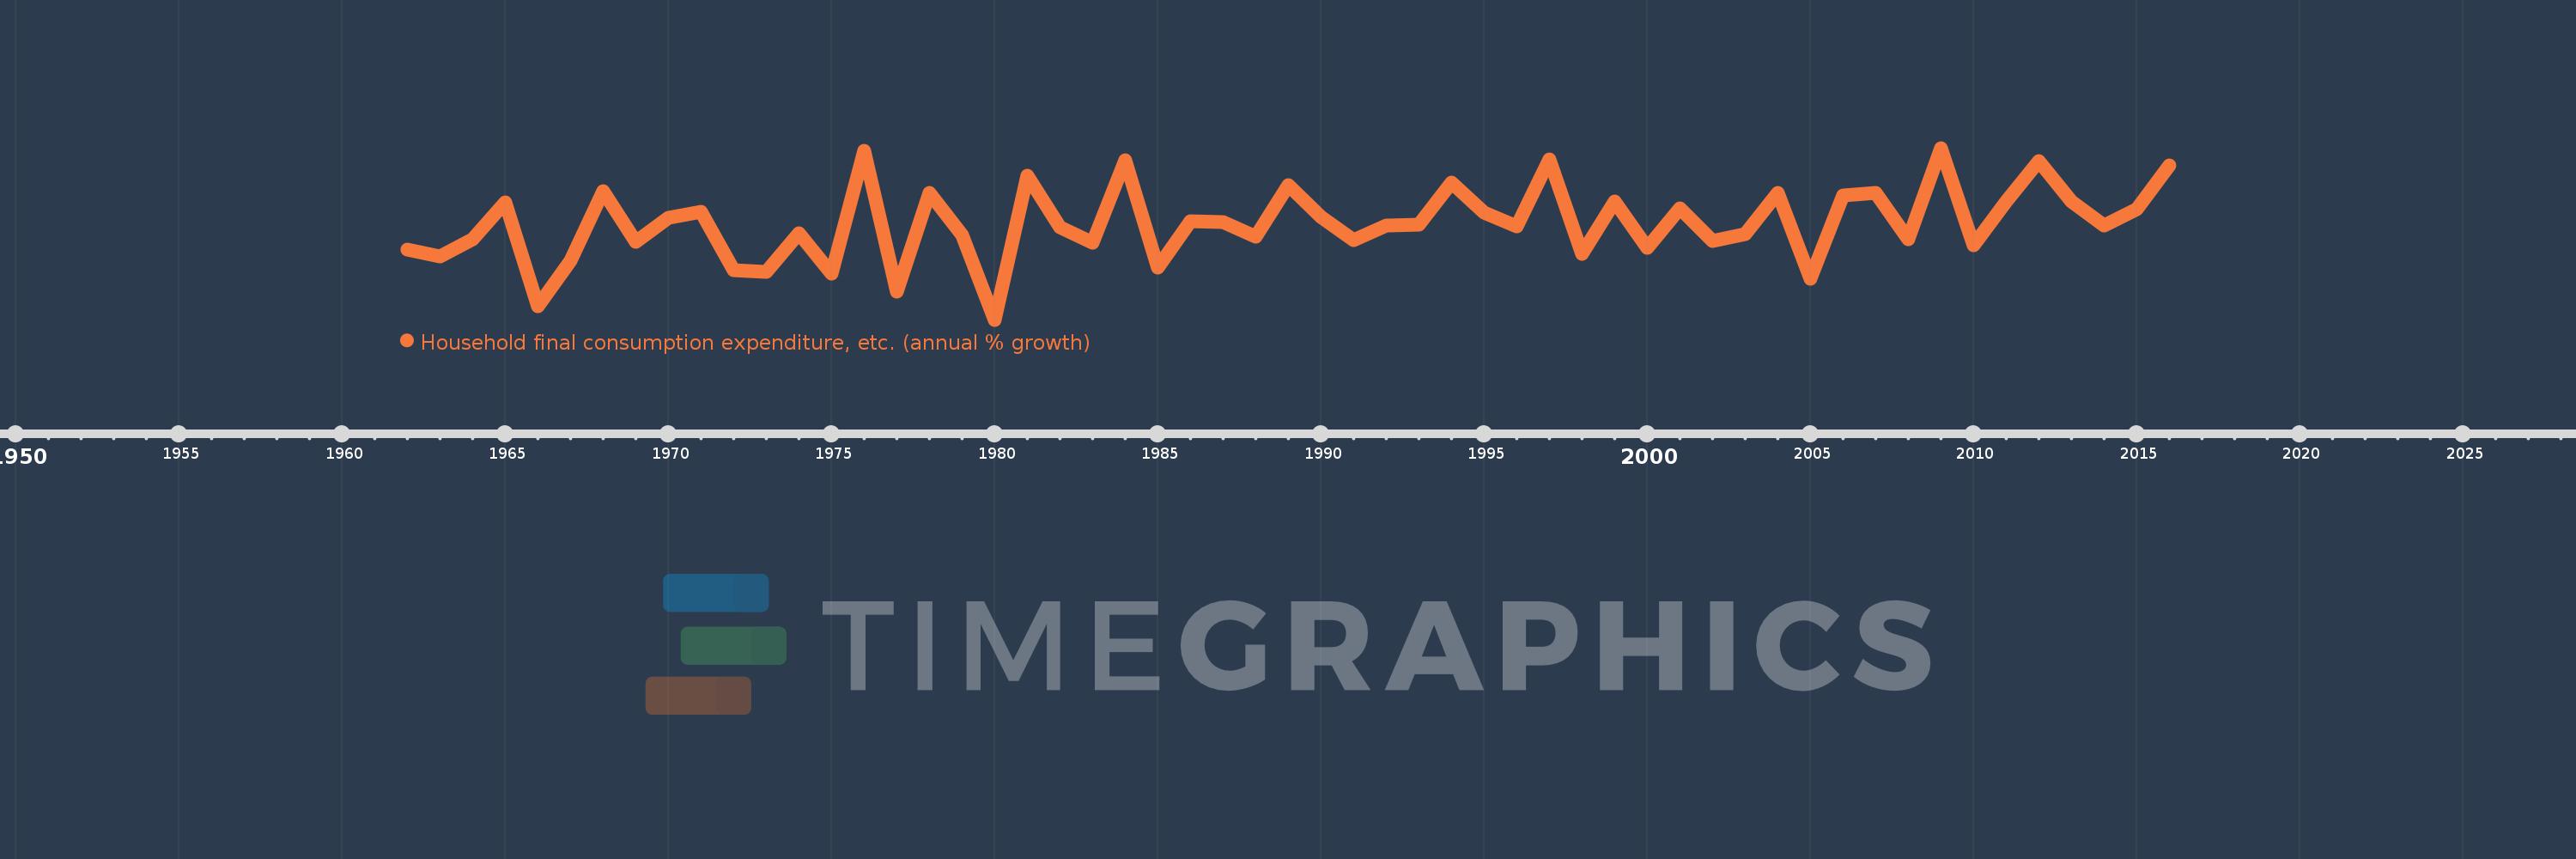
Household final consumption expenditure, etc. (annual % growth)
2016,2015,2014,2013,2012,2011,2010,2009,2008,2007,2006,2005,2004,2003,2002,2001,2000,1999,1998,1997,1996,1995,1994,1993,1992,1991,1990,1989,1988,1987,1986,1985,1984,1983,1982,1981,1980,1979,1978,1977,1976,1975,1974,1973,1972,1971,1970,1969,1968,1967,1966,1965,1964,1963,1962
This statistics in other country:
AlbaniaAlgeriaAntigua and BarbudaArab WorldArgentinaArmeniaAustraliaAustriaAzerbaijanBahamas, TheBahrainBangladeshBarbadosBelarusBelgiumBelizeBeninBhutanBoliviaBosnia and HerzegovinaBotswanaBrazilBrunei DarussalamBulgariaBurkina FasoBurundiCabo VerdeCambodiaCameroonCanadaCaribbean small statesCentral Europe and the BalticsChadChileColombiaComorosCongo, Dem. Rep.Congo, Rep.Costa RicaCote d'IvoireCroatiaCubaCyprusCzech RepublicDenmarkDjiboutiDominican RepublicEarly-demographic dividendEast Asia & PacificEcuadorEgypt, Arab Rep.El SalvadorEquatorial GuineaEritreaEstoniaEthiopiaEuro areaEurope & Central AsiaEurope & Central Asia (excluding high income)Europe & Central Asia (IDA & IBRD countries)European UnionFijiFinlandFranceGabonGambia, TheGeorgiaGermanyGhanaGreeceGuatemalaGuineaGuinea-BissauHaitiHeavily indebted poor countries (HIPC)High incomeHondurasHong Kong SAR, ChinaHungaryIBRD onlyIcelandIDA & IBRD totalIDA blendIDA onlyIDA totalIndiaIndonesiaIran, Islamic Rep.IrelandIsraelItalyJamaicaJapanJordanKazakhstanKenyaKorea, Rep.KosovoKuwaitKyrgyz RepublicLao PDRLatin America & Caribbean Latin America & Caribbean (excluding high income)Latin America & the Caribbean (IDA & IBRD countries)LatviaLeast developed countries: UN classificationLebanonLiberiaLithuaniaLow & middle incomeLow incomeLower middle incomeLuxembourgMacao SAR, ChinaMacedonia, FYRMadagascarMalawiMalaysiaMaliMaltaMarshall IslandsMauritaniaMauritiusMexicoMiddle East & North AfricaMiddle East & North Africa (excluding high income)Middle East & North Africa (IDA & IBRD countries)Middle incomeMoldovaMongoliaMontenegroMoroccoMozambiqueNamibiaNepalNetherlandsNew ZealandNicaraguaNigerNigeriaNorth AmericaNorwayOECD membersOmanOther small statesPakistanPanamaPapua New GuineaParaguayPeruPhilippinesPolandPortugalPost-demographic dividendPre-demographic dividendPuerto RicoQatarRomaniaRussian FederationRwandaSaudi ArabiaSenegalSerbiaSeychellesSierra LeoneSingaporeSlovak RepublicSloveniaSmall statesSomaliaSouth AfricaSouth AsiaSouth Asia (IDA & IBRD)South SudanSpainSri LankaSub-Saharan Africa Sub-Saharan Africa (excluding high income)Sub-Saharan Africa (IDA & IBRD countries)SudanSurinameSwazilandSwedenSwitzerlandSyrian Arab RepublicTajikistanTanzaniaThailandTimor-LesteTogoTrinidad and TobagoTunisiaTurkeyTurkmenistanUgandaUkraineUnited Arab EmiratesUnited KingdomUnited StatesUpper middle incomeUruguayVanuatuVenezuela, RBVietnamWest Bank and GazaWorldZambiaZimbabwe Timeline:
This timeline shows a graph from 1962 to 2016 of India. No data until 1961. Number of actual observations by date: 55.
Source name:
World Development Indicators
Source organization:
World Bank national accounts data, and OECD National Accounts data files.
Categories, topics:
Economy & Growth
Last updated:
apr 23, 2017
Indicators value changes by year
Minimum:
-6.908
jan 1, 1980
Maximum:
13.856
jan 1, 2009
At the date of observation
Value
Absolute change
Change from previous value
jan 1, 1962
1.589
+1.589
0.0%
jan 1, 1963
0.731
-0.858
-53.97%
jan 1, 1964
2.774
+2.043
279.31%
jan 1, 1965
7.288
+4.513
162.69%
jan 1, 1966
-5.262
-12.55
-172.21%
jan 1, 1967
0.251
+5.513
-104.77%
jan 1, 1968
8.601
+8.35
3.33K%
jan 1, 1969
2.533
-6.068
-70.55%
jan 1, 1970
5.441
+2.908
114.79%
jan 1, 1971
6.119
+0.678
12.47%
jan 1, 1972
-0.875
-6.994
-114.29%
jan 1, 1973
-1.092
-0.217
24.86%
jan 1, 1974
3.544
+4.636
-424.53%
jan 1, 1975
-1.334
-4.877
-137.63%
jan 1, 1976
13.47
+14.804
-1.11K%
jan 1, 1977
-3.521
-16.991
-126.14%
jan 1, 1978
8.384
+11.905
-338.13%
jan 1, 1979
3.385
-4.998
-59.62%
jan 1, 1980
-6.908
-10.293
-304.05%
jan 1, 1981
10.549
+17.457
-252.71%
jan 1, 1982
4.241
-6.308
-59.8%
jan 1, 1983
2.444
-1.797
-42.37%
jan 1, 1984
12.39
+9.946
406.96%
jan 1, 1985
-0.593
-12.984
-104.79%
jan 1, 1986
5.036
+5.629
-948.64%
jan 1, 1987
4.849
-0.187
-3.72%
jan 1, 1988
3.084
-1.765
-36.39%
jan 1, 1989
9.312
+6.228
201.93%
jan 1, 1990
5.554
-3.758
-40.36%
jan 1, 1991
2.685
-2.869
-51.66%
jan 1, 1992
4.451
+1.766
65.79%
jan 1, 1993
4.541
+0.09
2.02%
jan 1, 1994
9.627
+5.086
111.99%
jan 1, 1995
6.059
-3.568
-37.06%
jan 1, 1996
4.359
-1.7
-28.06%
jan 1, 1997
12.488
+8.13
186.52%
jan 1, 1998
1.042
-11.446
-91.65%
jan 1, 1999
7.338
+6.296
604.1%
jan 1, 2000
1.829
-5.509
-75.08%
jan 1, 2001
6.562
+4.733
258.8%
jan 1, 2002
2.661
-3.901
-59.45%
jan 1, 2003
3.481
+0.82
30.83%
jan 1, 2004
8.383
+4.902
140.8%
jan 1, 2005
-1.916
-10.298
-122.85%
jan 1, 2006
8.12
+10.036
-523.91%
jan 1, 2007
8.413
+0.293
3.61%
jan 1, 2008
2.787
-5.626
-66.87%
jan 1, 2009
13.856
+11.069
397.09%
jan 1, 2010
2.047
-11.809
-85.22%
jan 1, 2011
7.437
+5.39
263.25%
jan 1, 2012
12.284
+4.847
65.17%
jan 1, 2013
7.355
-4.929
-40.12%
jan 1, 2014
4.486
-2.869
-39.01%
jan 1, 2015
6.447
+1.961
43.71%
jan 1, 2016
11.785
+5.338
82.8%
Ranking of countries by current statistics by years


Comments: