29
/
en
AIzaSyAYiBZKx7MnpbEhh9jyipgxe19OcubqV5w
April 1, 2024
49073
Middle East & North Africa (excluding high income)
MNA
false
2
1
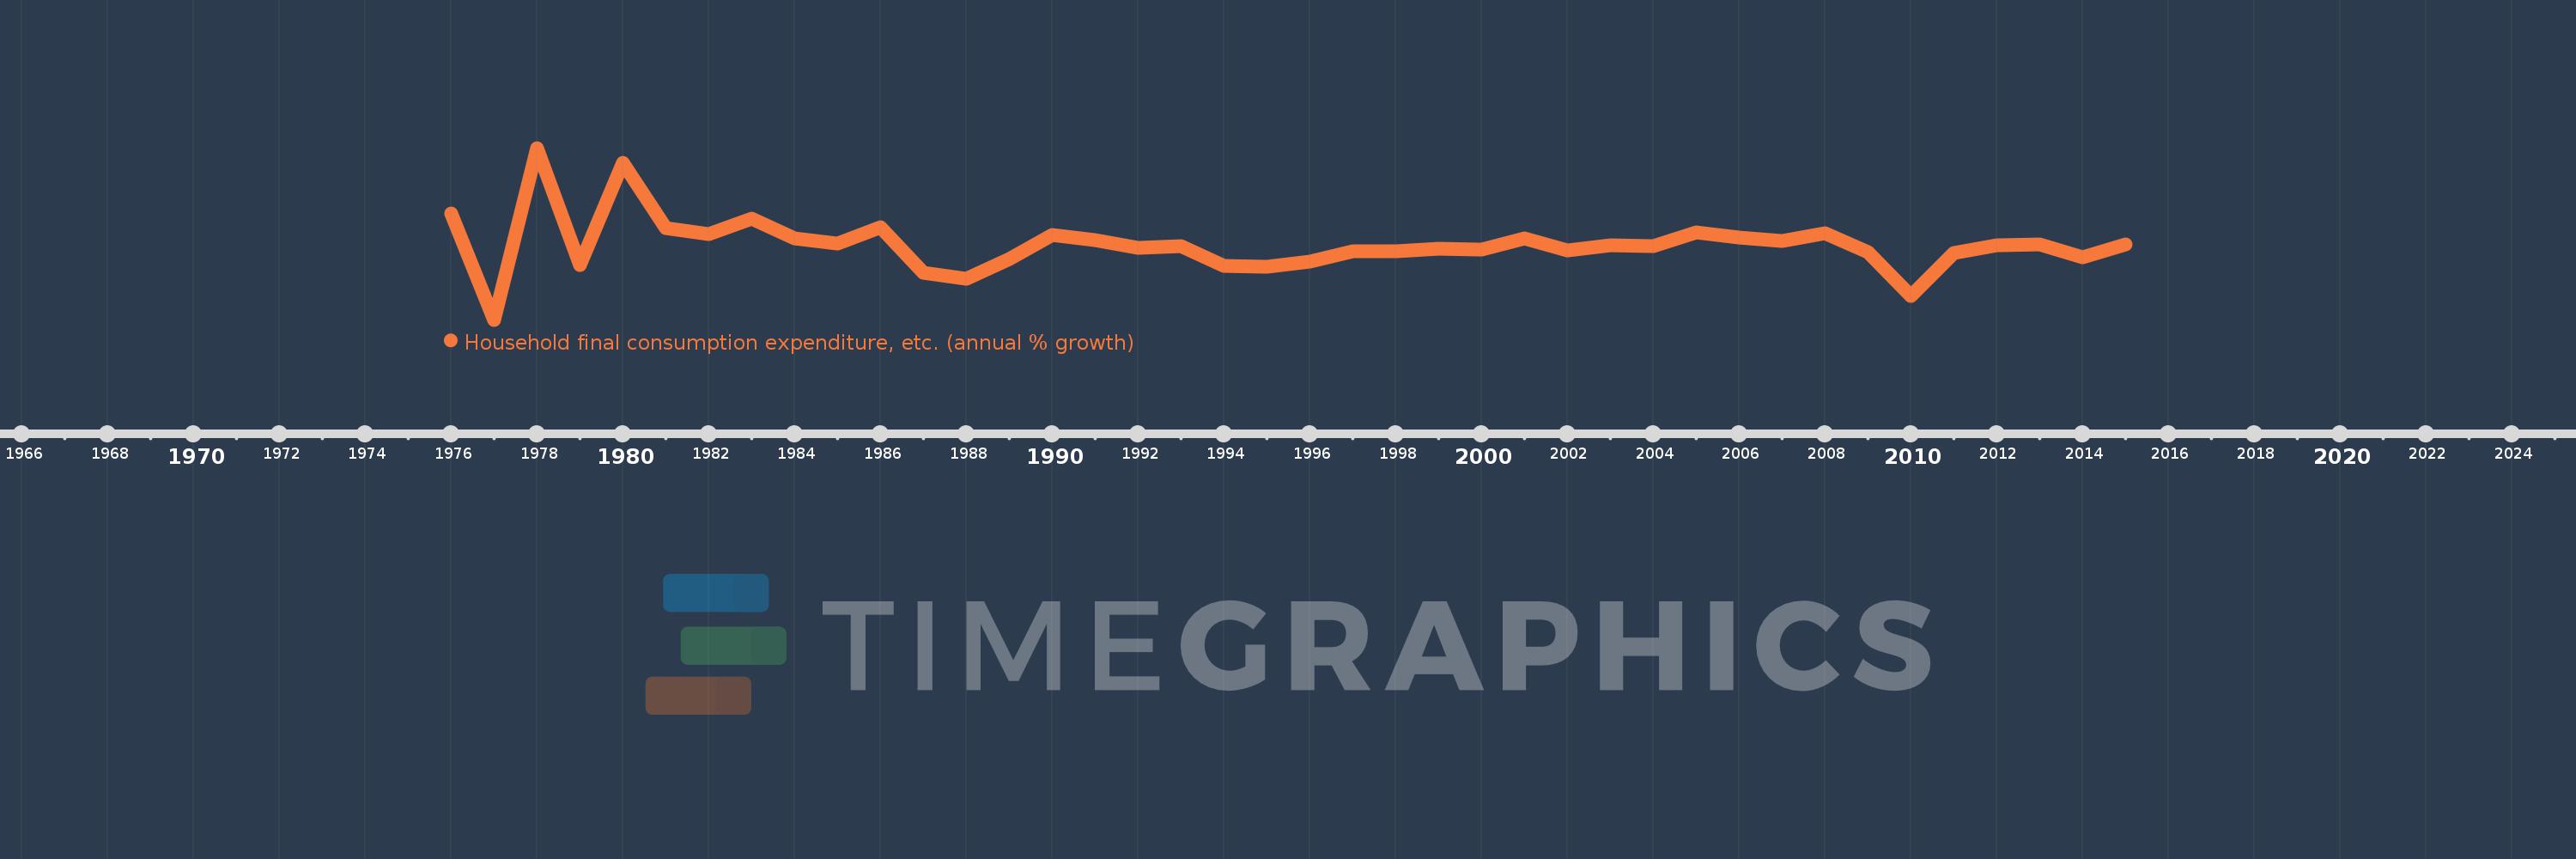
Household final consumption expenditure, etc. (annual % growth)
2015,2014,2013,2012,2011,2010,2009,2008,2007,2006,2005,2004,2003,2002,2001,2000,1999,1998,1997,1996,1995,1994,1993,1992,1991,1990,1989,1988,1987,1986,1985,1984,1983,1982,1981,1980,1979,1978,1977,1976
This statistics in other country:
AlbaniaAlgeriaAntigua and BarbudaArab WorldArgentinaArmeniaAustraliaAustriaAzerbaijanBahamas, TheBahrainBangladeshBarbadosBelarusBelgiumBelizeBeninBhutanBoliviaBosnia and HerzegovinaBotswanaBrazilBrunei DarussalamBulgariaBurkina FasoBurundiCabo VerdeCambodiaCameroonCanadaCaribbean small statesCentral Europe and the BalticsChadChileColombiaComorosCongo, Dem. Rep.Congo, Rep.Costa RicaCote d'IvoireCroatiaCubaCyprusCzech RepublicDenmarkDjiboutiDominican RepublicEarly-demographic dividendEast Asia & PacificEcuadorEgypt, Arab Rep.El SalvadorEquatorial GuineaEritreaEstoniaEthiopiaEuro areaEurope & Central AsiaEurope & Central Asia (excluding high income)Europe & Central Asia (IDA & IBRD countries)European UnionFijiFinlandFranceGabonGambia, TheGeorgiaGermanyGhanaGreeceGuatemalaGuineaGuinea-BissauHaitiHeavily indebted poor countries (HIPC)High incomeHondurasHong Kong SAR, ChinaHungaryIBRD onlyIcelandIDA & IBRD totalIDA blendIDA onlyIDA totalIndiaIndonesiaIran, Islamic Rep.IrelandIsraelItalyJamaicaJapanJordanKazakhstanKenyaKorea, Rep.KosovoKuwaitKyrgyz RepublicLao PDRLatin America & Caribbean Latin America & Caribbean (excluding high income)Latin America & the Caribbean (IDA & IBRD countries)LatviaLeast developed countries: UN classificationLebanonLiberiaLithuaniaLow & middle incomeLow incomeLower middle incomeLuxembourgMacao SAR, ChinaMacedonia, FYRMadagascarMalawiMalaysiaMaliMaltaMarshall IslandsMauritaniaMauritiusMexicoMiddle East & North AfricaMiddle East & North Africa (excluding high income)Middle East & North Africa (IDA & IBRD countries)Middle incomeMoldovaMongoliaMontenegroMoroccoMozambiqueNamibiaNepalNetherlandsNew ZealandNicaraguaNigerNigeriaNorth AmericaNorwayOECD membersOmanOther small statesPakistanPanamaPapua New GuineaParaguayPeruPhilippinesPolandPortugalPost-demographic dividendPre-demographic dividendPuerto RicoQatarRomaniaRussian FederationRwandaSaudi ArabiaSenegalSerbiaSeychellesSierra LeoneSingaporeSlovak RepublicSloveniaSmall statesSomaliaSouth AfricaSouth AsiaSouth Asia (IDA & IBRD)South SudanSpainSri LankaSub-Saharan Africa Sub-Saharan Africa (excluding high income)Sub-Saharan Africa (IDA & IBRD countries)SudanSurinameSwazilandSwedenSwitzerlandSyrian Arab RepublicTajikistanTanzaniaThailandTimor-LesteTogoTrinidad and TobagoTunisiaTurkeyTurkmenistanUgandaUkraineUnited Arab EmiratesUnited KingdomUnited StatesUpper middle incomeUruguayVanuatuVenezuela, RBVietnamWest Bank and GazaWorldZambiaZimbabwe Timeline:
This timeline shows a graph from 1976 to 2015 of Middle East & North Africa (excluding high income). No data until 1975. Number of actual observations by date: 40.
Source name:
World Development Indicators
Source organization:
World Bank national accounts data, and OECD National Accounts data files.
Categories, topics:
Economy & Growth
Last updated:
apr 23, 2017
Indicators value changes by year
Minimum:
-12.981
jan 1, 1977
Maximum:
26.887
jan 1, 1978
At the date of observation
Value
Absolute change
Change from previous value
jan 1, 1976
11.647
+11.647
0.0%
jan 1, 1977
-12.981
-24.628
-211.45%
jan 1, 1978
26.887
+39.869
-307.13%
jan 1, 1979
-0.188
-27.076
-100.7%
jan 1, 1980
23.489
+23.678
-12.58K%
jan 1, 1981
8.253
-15.236
-64.86%
jan 1, 1982
6.969
-1.284
-15.55%
jan 1, 1983
10.55
+3.581
51.38%
jan 1, 1984
5.967
-4.584
-43.44%
jan 1, 1985
4.605
-1.362
-22.82%
jan 1, 1986
8.446
+3.841
83.39%
jan 1, 1987
-2.052
-10.497
-124.29%
jan 1, 1988
-3.538
-1.486
72.46%
jan 1, 1989
1.176
+4.715
-133.25%
jan 1, 1990
6.776
+5.6
476.0%
jan 1, 1991
5.419
-1.357
-20.03%
jan 1, 1992
3.77
-1.65
-30.44%
jan 1, 1993
4.106
+0.336
8.91%
jan 1, 1994
-0.536
-4.642
-113.06%
jan 1, 1995
-0.769
-0.233
43.36%
jan 1, 1996
0.491
+1.26
-163.82%
jan 1, 1997
2.951
+2.46
501.36%
jan 1, 1998
2.81
-0.141
-4.77%
jan 1, 1999
3.453
+0.642
22.86%
jan 1, 2000
3.375
-0.078
-2.25%
jan 1, 2001
5.816
+2.442
72.35%
jan 1, 2002
3.179
-2.637
-45.34%
jan 1, 2003
4.281
+1.102
34.68%
jan 1, 2004
4.034
-0.247
-5.77%
jan 1, 2005
7.344
+3.309
82.03%
jan 1, 2006
6.191
-1.153
-15.7%
jan 1, 2007
5.226
-0.965
-15.59%
jan 1, 2008
7.052
+1.827
34.96%
jan 1, 2009
2.622
-4.43
-62.82%
jan 1, 2010
-7.444
-10.066
-383.92%
jan 1, 2011
2.584
+10.028
-134.71%
jan 1, 2012
4.303
+1.719
66.53%
jan 1, 2013
4.546
+0.243
5.65%
jan 1, 2014
1.43
-3.117
-68.55%
jan 1, 2015
4.414
+2.984
208.68%
Ranking of countries by current statistics by years


Comments: