29
/
en
AIzaSyAYiBZKx7MnpbEhh9jyipgxe19OcubqV5w
April 1, 2024
153640
Iceland
ISL
true
2
1
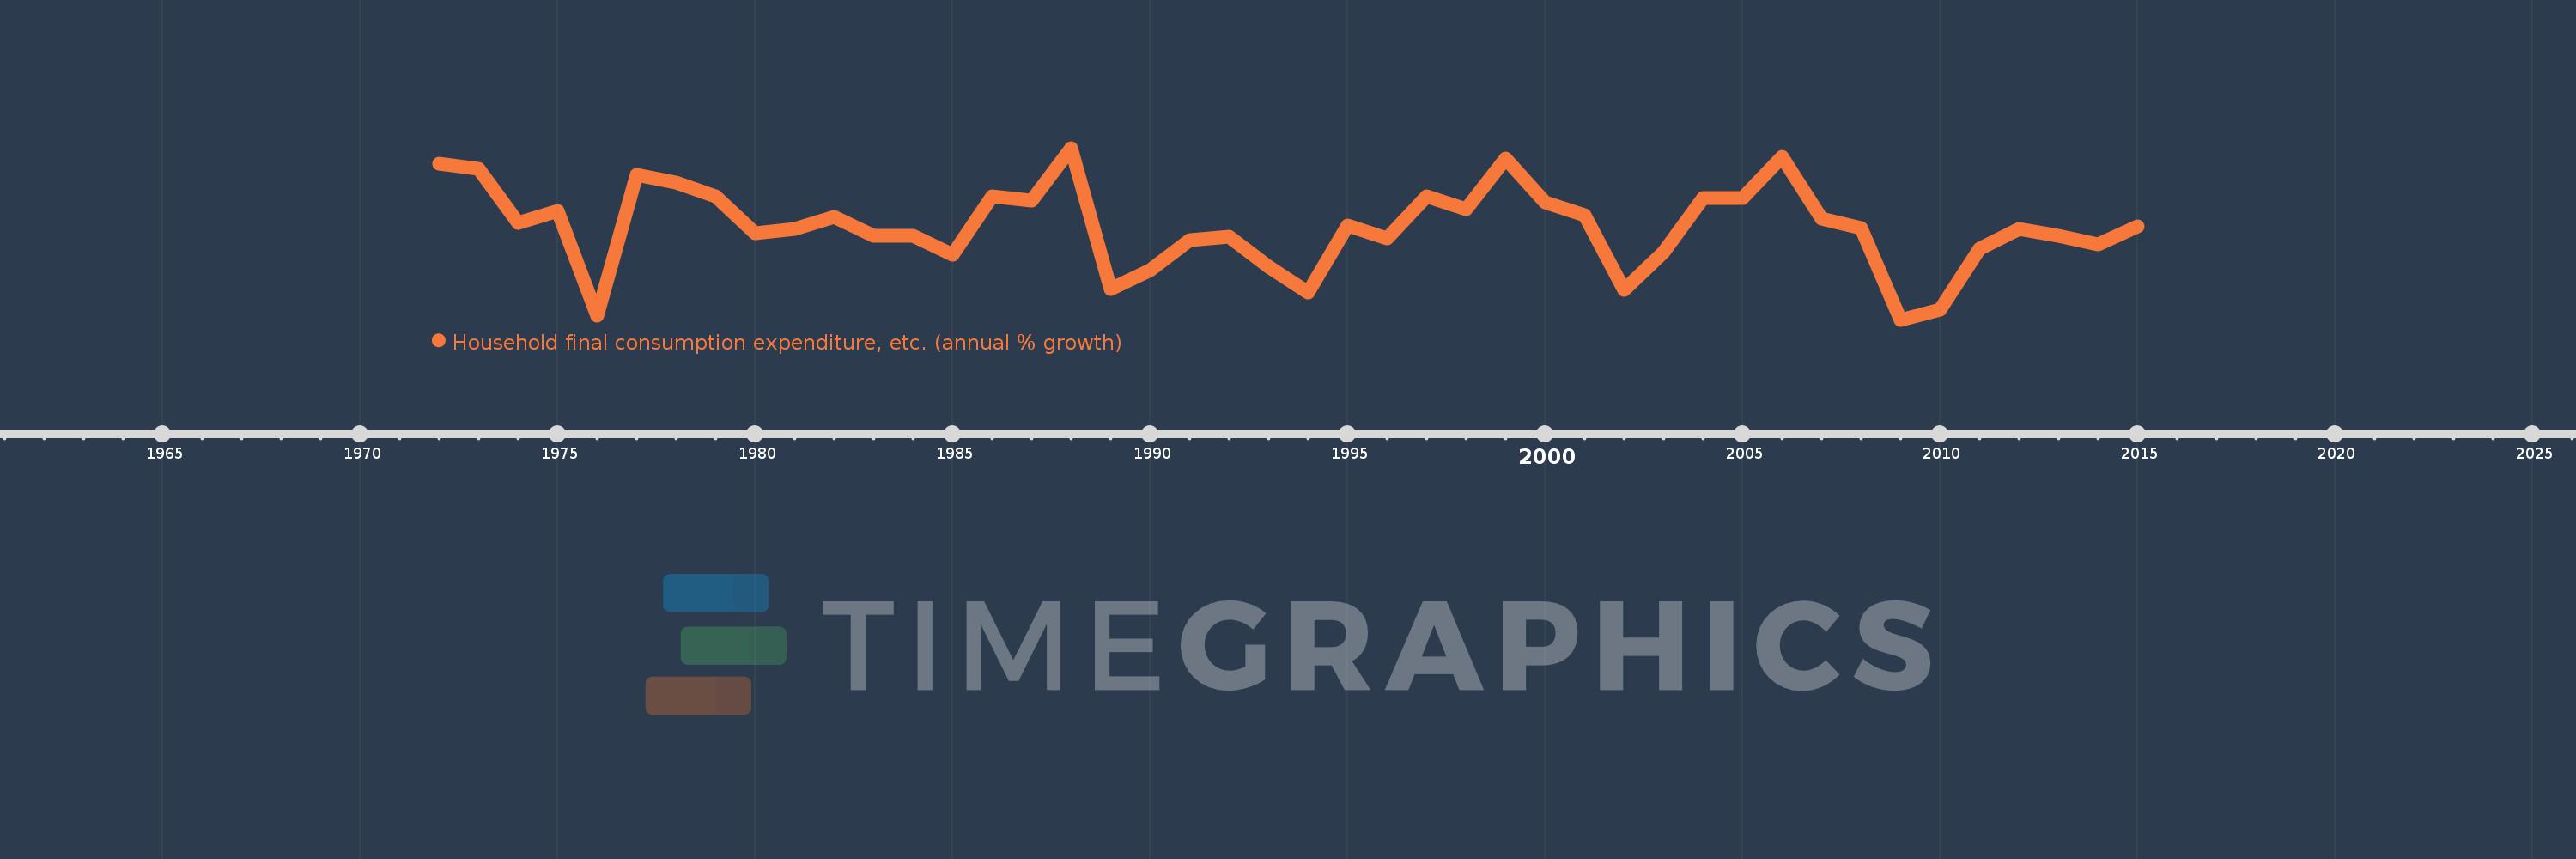
Household final consumption expenditure, etc. (annual % growth)
2015,2014,2013,2012,2011,2010,2009,2008,2007,2006,2005,2004,2003,2002,2001,2000,1999,1998,1997,1996,1995,1994,1993,1992,1991,1990,1989,1988,1987,1986,1985,1984,1983,1982,1981,1980,1979,1978,1977,1976,1975,1974,1973,1972
This statistics in other country:
AlbaniaAlgeriaAntigua and BarbudaArab WorldArgentinaArmeniaAustraliaAustriaAzerbaijanBahamas, TheBahrainBangladeshBarbadosBelarusBelgiumBelizeBeninBhutanBoliviaBosnia and HerzegovinaBotswanaBrazilBrunei DarussalamBulgariaBurkina FasoBurundiCabo VerdeCambodiaCameroonCanadaCaribbean small statesCentral Europe and the BalticsChadChileColombiaComorosCongo, Dem. Rep.Congo, Rep.Costa RicaCote d'IvoireCroatiaCubaCyprusCzech RepublicDenmarkDjiboutiDominican RepublicEarly-demographic dividendEast Asia & PacificEcuadorEgypt, Arab Rep.El SalvadorEquatorial GuineaEritreaEstoniaEthiopiaEuro areaEurope & Central AsiaEurope & Central Asia (excluding high income)Europe & Central Asia (IDA & IBRD countries)European UnionFijiFinlandFranceGabonGambia, TheGeorgiaGermanyGhanaGreeceGuatemalaGuineaGuinea-BissauHaitiHeavily indebted poor countries (HIPC)High incomeHondurasHong Kong SAR, ChinaHungaryIBRD onlyIcelandIDA & IBRD totalIDA blendIDA onlyIDA totalIndiaIndonesiaIran, Islamic Rep.IrelandIsraelItalyJamaicaJapanJordanKazakhstanKenyaKorea, Rep.KosovoKuwaitKyrgyz RepublicLao PDRLatin America & Caribbean Latin America & Caribbean (excluding high income)Latin America & the Caribbean (IDA & IBRD countries)LatviaLeast developed countries: UN classificationLebanonLiberiaLithuaniaLow & middle incomeLow incomeLower middle incomeLuxembourgMacao SAR, ChinaMacedonia, FYRMadagascarMalawiMalaysiaMaliMaltaMarshall IslandsMauritaniaMauritiusMexicoMiddle East & North AfricaMiddle East & North Africa (excluding high income)Middle East & North Africa (IDA & IBRD countries)Middle incomeMoldovaMongoliaMontenegroMoroccoMozambiqueNamibiaNepalNetherlandsNew ZealandNicaraguaNigerNigeriaNorth AmericaNorwayOECD membersOmanOther small statesPakistanPanamaPapua New GuineaParaguayPeruPhilippinesPolandPortugalPost-demographic dividendPre-demographic dividendPuerto RicoQatarRomaniaRussian FederationRwandaSaudi ArabiaSenegalSerbiaSeychellesSierra LeoneSingaporeSlovak RepublicSloveniaSmall statesSomaliaSouth AfricaSouth AsiaSouth Asia (IDA & IBRD)South SudanSpainSri LankaSub-Saharan Africa Sub-Saharan Africa (excluding high income)Sub-Saharan Africa (IDA & IBRD countries)SudanSurinameSwazilandSwedenSwitzerlandSyrian Arab RepublicTajikistanTanzaniaThailandTimor-LesteTogoTrinidad and TobagoTunisiaTurkeyTurkmenistanUgandaUkraineUnited Arab EmiratesUnited KingdomUnited StatesUpper middle incomeUruguayVanuatuVenezuela, RBVietnamWest Bank and GazaWorldZambiaZimbabwe Timeline:
This timeline shows a graph from 1972 to 2015 of Iceland. No data until 1971. Number of actual observations by date: 44.
Source name:
World Development Indicators
Source organization:
World Bank national accounts data, and OECD National Accounts data files.
Categories, topics:
Economy & Growth
Last updated:
apr 23, 2017
Indicators value changes by year
Minimum:
-12.528
jan 1, 2009
Maximum:
16.891
jan 1, 1988
At the date of observation
Value
Absolute change
Change from previous value
jan 1, 1972
14.127
+14.127
0.0%
jan 1, 1973
13.265
-0.862
-6.1%
jan 1, 1974
4.052
-9.214
-69.46%
jan 1, 1975
6.09
+2.038
50.3%
jan 1, 1976
-11.885
-17.975
-295.18%
jan 1, 1977
12.232
+24.118
-202.92%
jan 1, 1978
11.017
-1.216
-9.94%
jan 1, 1979
8.601
-2.415
-21.92%
jan 1, 1980
2.325
-6.276
-72.97%
jan 1, 1981
3.027
+0.702
30.21%
jan 1, 1982
5.092
+2.065
68.21%
jan 1, 1983
1.86
-3.232
-63.47%
jan 1, 1984
1.861
+0.001
0.06%
jan 1, 1985
-1.344
-3.205
-172.21%
jan 1, 1986
8.554
+9.898
-736.47%
jan 1, 1987
7.912
-0.641
-7.5%
jan 1, 1988
16.891
+8.979
113.48%
jan 1, 1989
-7.333
-24.225
-143.41%
jan 1, 1990
-4.068
+3.266
-44.53%
jan 1, 1991
1.153
+5.221
-128.35%
jan 1, 1992
1.704
+0.55
47.73%
jan 1, 1993
-3.442
-5.146
-302.0%
jan 1, 1994
-7.936
-4.494
130.58%
jan 1, 1995
3.536
+11.472
-144.56%
jan 1, 1996
1.43
-2.107
-59.57%
jan 1, 1997
8.673
+7.244
506.68%
jan 1, 1998
6.373
-2.3
-26.52%
jan 1, 1999
15.063
+8.69
136.35%
jan 1, 2000
7.524
-7.539
-50.05%
jan 1, 2001
5.327
-2.197
-29.2%
jan 1, 2002
-7.408
-12.735
-239.06%
jan 1, 2003
-0.903
+6.505
-87.81%
jan 1, 2004
8.267
+9.17
-1.02K%
jan 1, 2005
8.28
+0.013
0.15%
jan 1, 2006
15.328
+7.048
85.12%
jan 1, 2007
4.714
-10.614
-69.25%
jan 1, 2008
3.12
-1.593
-33.81%
jan 1, 2009
-12.528
-15.648
-501.53%
jan 1, 2010
-10.819
+1.71
-13.65%
jan 1, 2011
-0.3
+10.518
-97.22%
jan 1, 2012
2.978
+3.278
-1.09K%
jan 1, 2013
1.868
-1.11
-37.28%
jan 1, 2014
0.305
-1.562
-83.65%
jan 1, 2015
3.498
+3.193
1.05K%
Ranking of countries by current statistics by years


Comments: