29
/
en
AIzaSyAYiBZKx7MnpbEhh9jyipgxe19OcubqV5w
April 1, 2024
33505
European Union
EUU
false
2
1
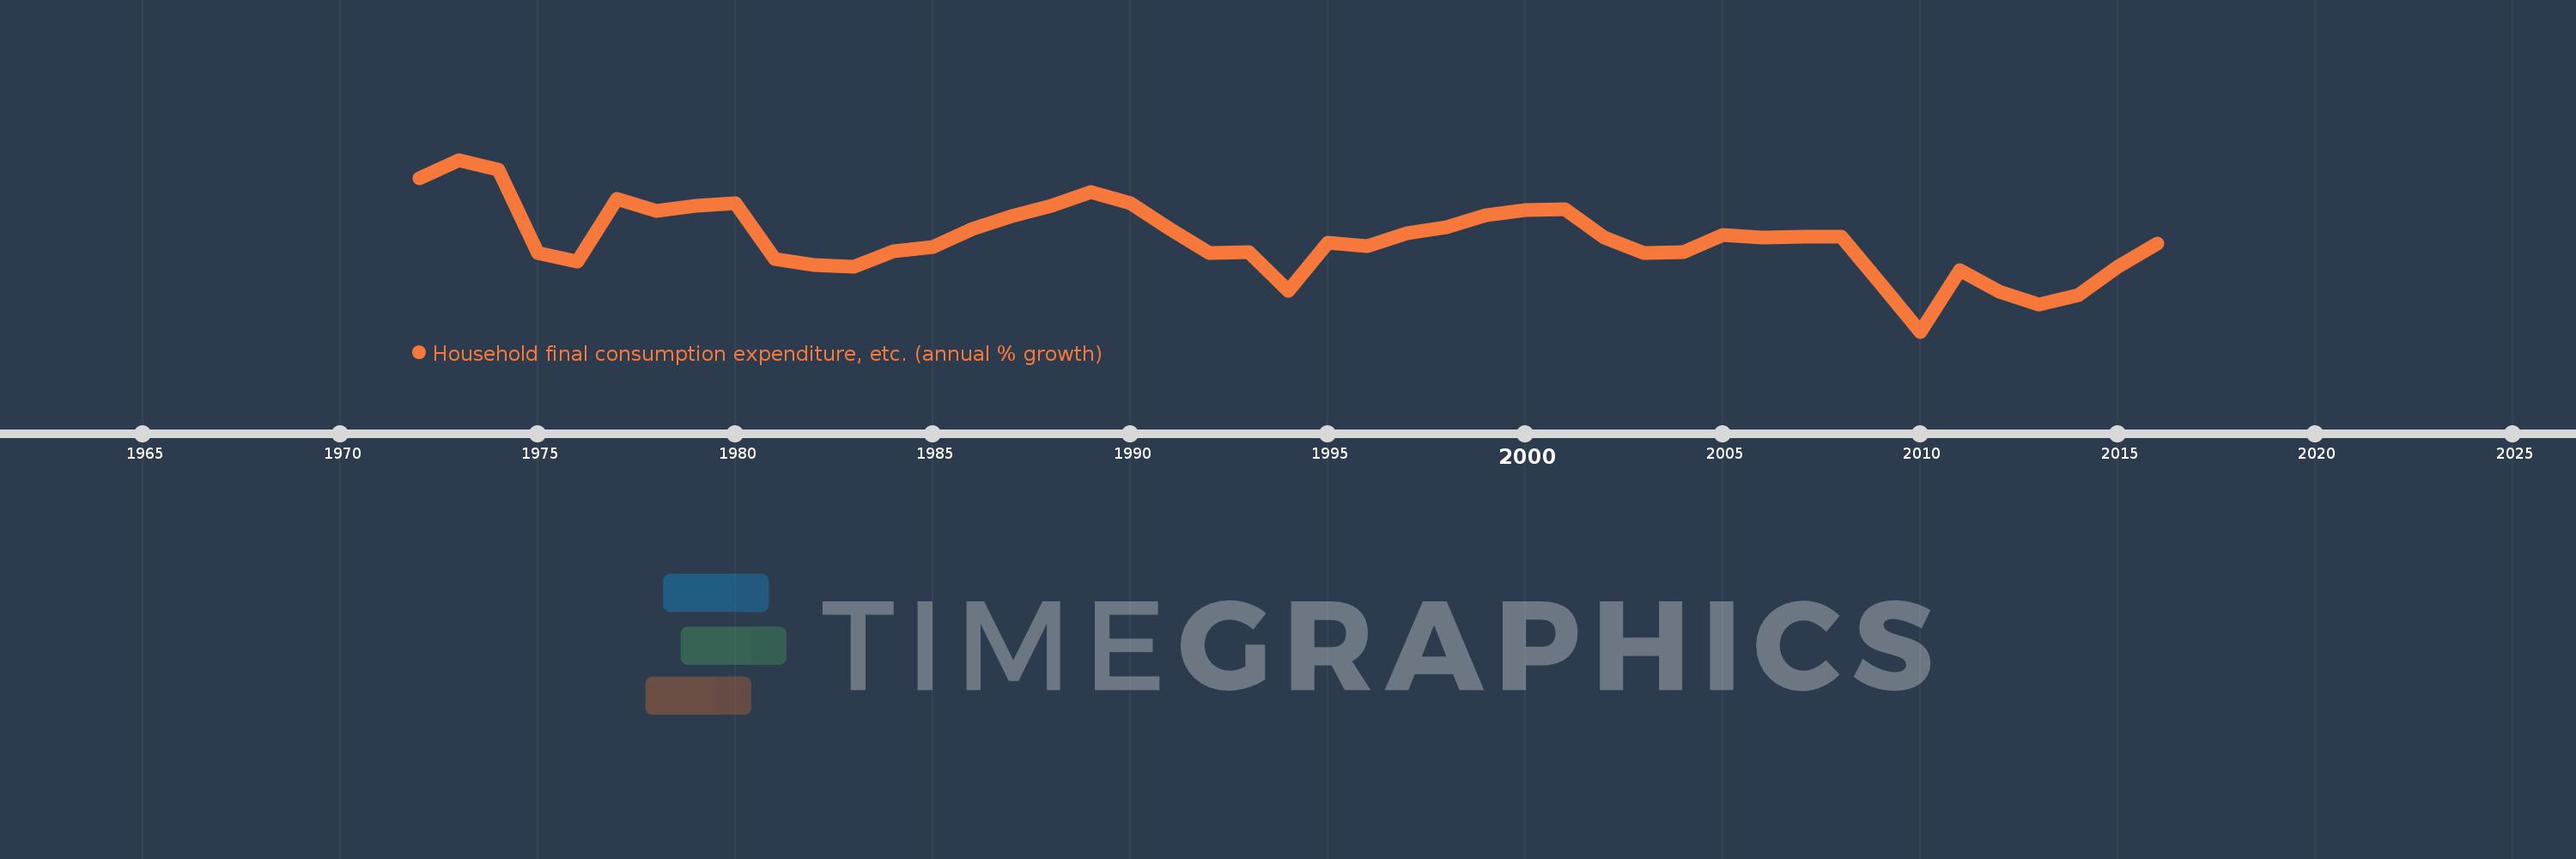
Household final consumption expenditure, etc. (annual % growth)
2016,2015,2014,2013,2012,2011,2010,2009,2008,2007,2006,2005,2004,2003,2002,2001,2000,1999,1998,1997,1996,1995,1994,1993,1992,1991,1990,1989,1988,1987,1986,1985,1984,1983,1982,1981,1980,1979,1978,1977,1976,1975,1974,1973,1972
This statistics in other country:
AlbaniaAlgeriaAntigua and BarbudaArab WorldArgentinaArmeniaAustraliaAustriaAzerbaijanBahamas, TheBahrainBangladeshBarbadosBelarusBelgiumBelizeBeninBhutanBoliviaBosnia and HerzegovinaBotswanaBrazilBrunei DarussalamBulgariaBurkina FasoBurundiCabo VerdeCambodiaCameroonCanadaCaribbean small statesCentral Europe and the BalticsChadChileColombiaComorosCongo, Dem. Rep.Congo, Rep.Costa RicaCote d'IvoireCroatiaCubaCyprusCzech RepublicDenmarkDjiboutiDominican RepublicEarly-demographic dividendEast Asia & PacificEcuadorEgypt, Arab Rep.El SalvadorEquatorial GuineaEritreaEstoniaEthiopiaEuro areaEurope & Central AsiaEurope & Central Asia (excluding high income)Europe & Central Asia (IDA & IBRD countries)European UnionFijiFinlandFranceGabonGambia, TheGeorgiaGermanyGhanaGreeceGuatemalaGuineaGuinea-BissauHaitiHeavily indebted poor countries (HIPC)High incomeHondurasHong Kong SAR, ChinaHungaryIBRD onlyIcelandIDA & IBRD totalIDA blendIDA onlyIDA totalIndiaIndonesiaIran, Islamic Rep.IrelandIsraelItalyJamaicaJapanJordanKazakhstanKenyaKorea, Rep.KosovoKuwaitKyrgyz RepublicLao PDRLatin America & Caribbean Latin America & Caribbean (excluding high income)Latin America & the Caribbean (IDA & IBRD countries)LatviaLeast developed countries: UN classificationLebanonLiberiaLithuaniaLow & middle incomeLow incomeLower middle incomeLuxembourgMacao SAR, ChinaMacedonia, FYRMadagascarMalawiMalaysiaMaliMaltaMarshall IslandsMauritaniaMauritiusMexicoMiddle East & North AfricaMiddle East & North Africa (excluding high income)Middle East & North Africa (IDA & IBRD countries)Middle incomeMoldovaMongoliaMontenegroMoroccoMozambiqueNamibiaNepalNetherlandsNew ZealandNicaraguaNigerNigeriaNorth AmericaNorwayOECD membersOmanOther small statesPakistanPanamaPapua New GuineaParaguayPeruPhilippinesPolandPortugalPost-demographic dividendPre-demographic dividendPuerto RicoQatarRomaniaRussian FederationRwandaSaudi ArabiaSenegalSerbiaSeychellesSierra LeoneSingaporeSlovak RepublicSloveniaSmall statesSomaliaSouth AfricaSouth AsiaSouth Asia (IDA & IBRD)South SudanSpainSri LankaSub-Saharan Africa Sub-Saharan Africa (excluding high income)Sub-Saharan Africa (IDA & IBRD countries)SudanSurinameSwazilandSwedenSwitzerlandSyrian Arab RepublicTajikistanTanzaniaThailandTimor-LesteTogoTrinidad and TobagoTunisiaTurkeyTurkmenistanUgandaUkraineUnited Arab EmiratesUnited KingdomUnited StatesUpper middle incomeUruguayVanuatuVenezuela, RBVietnamWest Bank and GazaWorldZambiaZimbabwe Timeline:
This timeline shows a graph from 1972 to 2016 of European Union. No data until 1971. Number of actual observations by date: 45.
Source name:
World Development Indicators
Source organization:
World Bank national accounts data, and OECD National Accounts data files.
Categories, topics:
Economy & Growth
Last updated:
apr 23, 2017
Indicators value changes by year
Minimum:
-1.632
jan 1, 2010
At the date of observation
Value
Absolute change
Change from previous value
jan 1, 1972
4.773
+4.773
0.0%
jan 1, 1973
5.554
+0.781
16.37%
jan 1, 1974
5.148
-0.406
-7.3%
jan 1, 1975
1.659
-3.49
-67.78%
jan 1, 1976
1.283
-0.376
-22.66%
jan 1, 1977
3.92
+2.637
205.59%
jan 1, 1978
3.413
-0.507
-12.93%
jan 1, 1979
3.642
+0.229
6.71%
jan 1, 1980
3.726
+0.084
2.3%
jan 1, 1981
1.389
-2.337
-62.71%
jan 1, 1982
1.162
-0.228
-16.38%
jan 1, 1983
1.07
-0.092
-7.92%
jan 1, 1984
1.728
+0.658
61.48%
jan 1, 1985
1.895
+0.167
9.67%
jan 1, 1986
2.679
+0.784
41.4%
jan 1, 1987
3.207
+0.528
19.7%
jan 1, 1988
3.64
+0.434
13.52%
jan 1, 1989
4.19
+0.55
15.1%
jan 1, 1990
3.736
-0.454
-10.84%
jan 1, 1991
2.661
-1.075
-28.77%
jan 1, 1992
1.649
-1.012
-38.04%
jan 1, 1993
1.707
+0.058
3.54%
jan 1, 1994
0.062
-1.645
-96.37%
jan 1, 1995
2.089
+2.027
3.27K%
jan 1, 1996
1.937
-0.152
-7.27%
jan 1, 1997
2.488
+0.551
28.45%
jan 1, 1998
2.74
+0.253
10.15%
jan 1, 1999
3.243
+0.503
18.36%
jan 1, 2000
3.45
+0.207
6.38%
jan 1, 2001
3.491
+0.041
1.19%
jan 1, 2002
2.295
-1.196
-34.26%
jan 1, 2003
1.661
-0.634
-27.62%
jan 1, 2004
1.709
+0.048
2.87%
jan 1, 2005
2.396
+0.688
40.23%
jan 1, 2006
2.298
-0.099
-4.12%
jan 1, 2007
2.346
+0.048
2.09%
jan 1, 2008
2.321
-0.025
-1.06%
jan 1, 2009
0.362
-1.959
-84.42%
jan 1, 2010
-1.632
-1.994
-551.44%
jan 1, 2011
0.932
+2.564
-157.1%
jan 1, 2012
0.03
-0.901
-96.73%
jan 1, 2013
-0.486
-0.516
-1.7K%
jan 1, 2014
-0.103
+0.383
-78.78%
jan 1, 2015
1.087
+1.19
-1.15K%
jan 1, 2016
2.057
+0.97
89.27%
Ranking of countries by current statistics by years


Comments: