29
/
en
AIzaSyAYiBZKx7MnpbEhh9jyipgxe19OcubqV5w
April 1, 2024
182178
Luxembourg
LUX
true
2
1
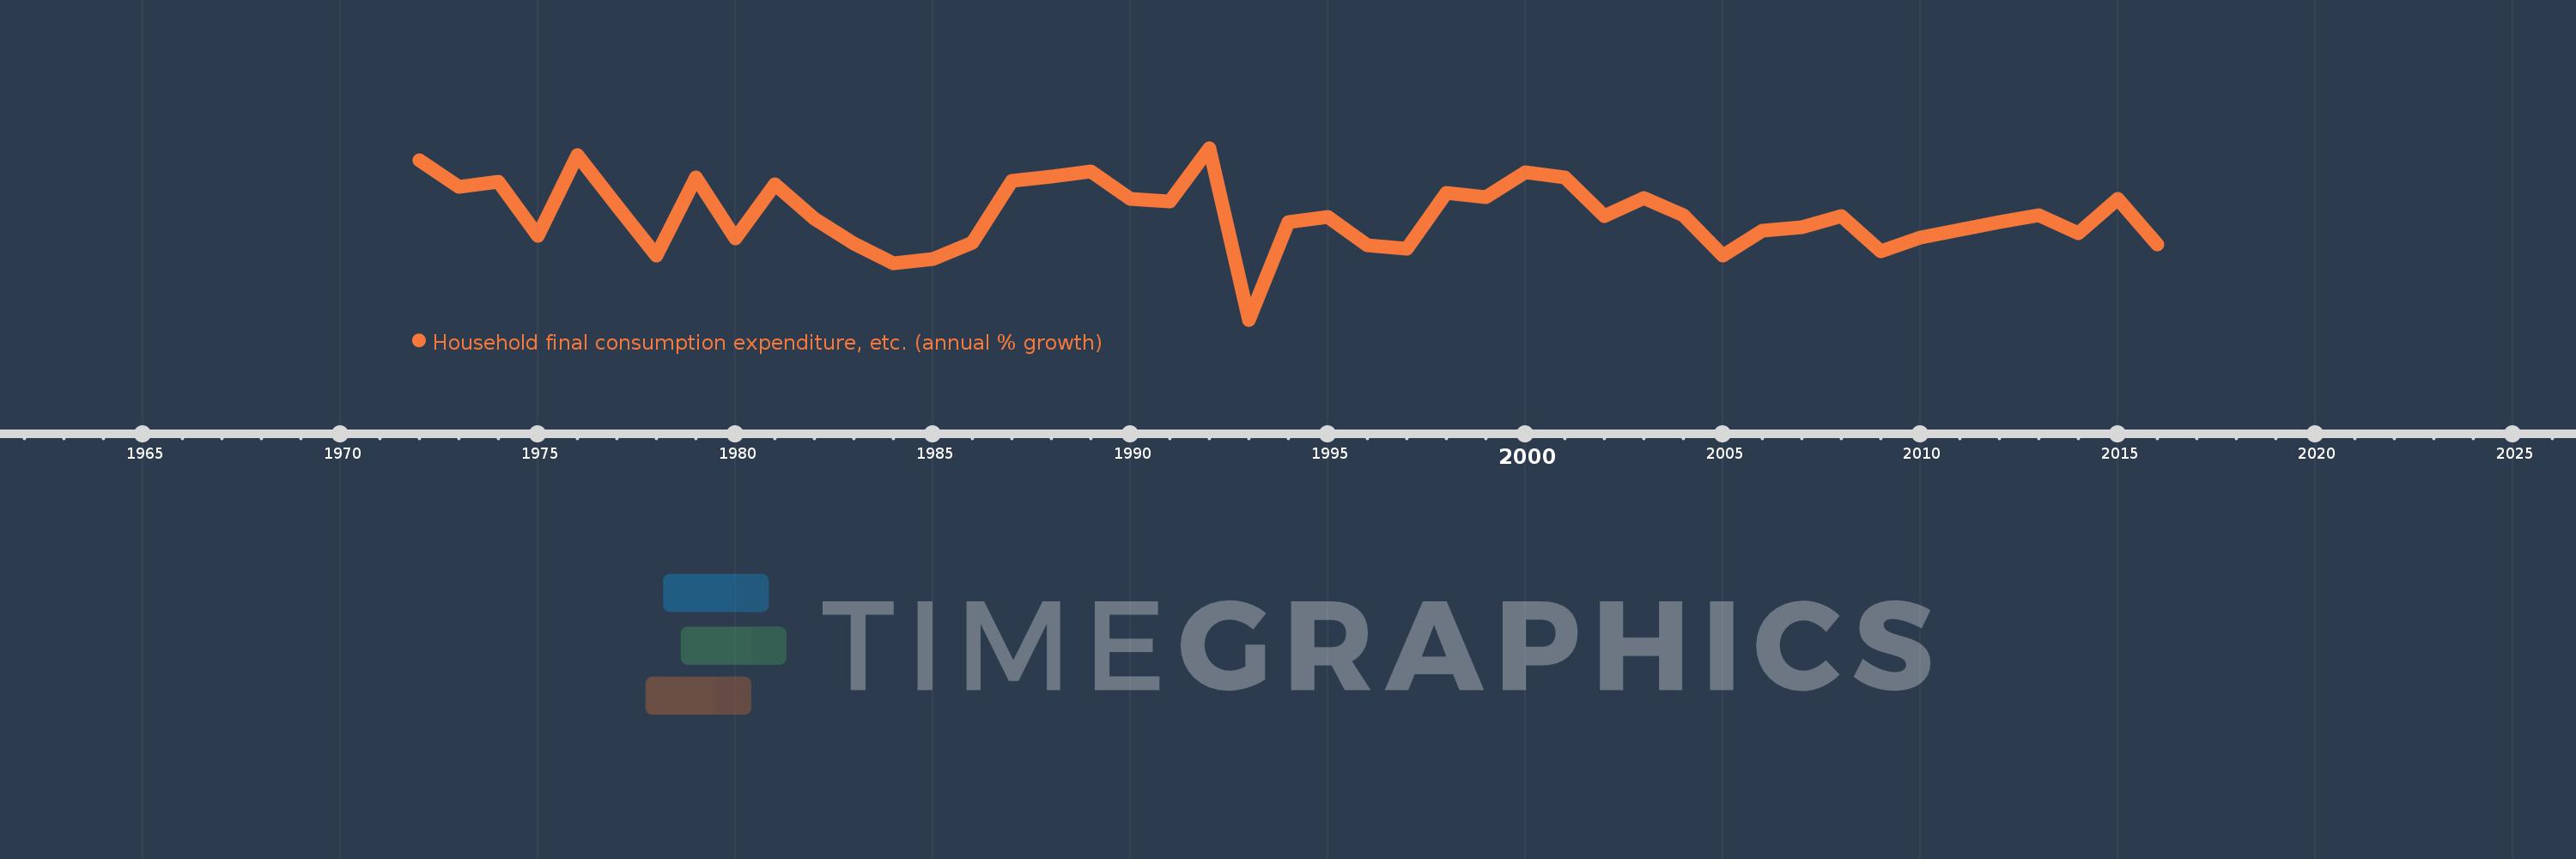
Household final consumption expenditure, etc. (annual % growth)
2016,2015,2014,2013,2012,2011,2010,2009,2008,2007,2006,2005,2004,2003,2002,2001,2000,1999,1998,1997,1996,1995,1994,1993,1992,1991,1990,1989,1988,1987,1986,1985,1984,1983,1982,1981,1980,1979,1978,1977,1976,1975,1974,1973,1972
This statistics in other country:
AlbaniaAlgeriaAntigua and BarbudaArab WorldArgentinaArmeniaAustraliaAustriaAzerbaijanBahamas, TheBahrainBangladeshBarbadosBelarusBelgiumBelizeBeninBhutanBoliviaBosnia and HerzegovinaBotswanaBrazilBrunei DarussalamBulgariaBurkina FasoBurundiCabo VerdeCambodiaCameroonCanadaCaribbean small statesCentral Europe and the BalticsChadChileColombiaComorosCongo, Dem. Rep.Congo, Rep.Costa RicaCote d'IvoireCroatiaCubaCyprusCzech RepublicDenmarkDjiboutiDominican RepublicEarly-demographic dividendEast Asia & PacificEcuadorEgypt, Arab Rep.El SalvadorEquatorial GuineaEritreaEstoniaEthiopiaEuro areaEurope & Central AsiaEurope & Central Asia (excluding high income)Europe & Central Asia (IDA & IBRD countries)European UnionFijiFinlandFranceGabonGambia, TheGeorgiaGermanyGhanaGreeceGuatemalaGuineaGuinea-BissauHaitiHeavily indebted poor countries (HIPC)High incomeHondurasHong Kong SAR, ChinaHungaryIBRD onlyIcelandIDA & IBRD totalIDA blendIDA onlyIDA totalIndiaIndonesiaIran, Islamic Rep.IrelandIsraelItalyJamaicaJapanJordanKazakhstanKenyaKorea, Rep.KosovoKuwaitKyrgyz RepublicLao PDRLatin America & Caribbean Latin America & Caribbean (excluding high income)Latin America & the Caribbean (IDA & IBRD countries)LatviaLeast developed countries: UN classificationLebanonLiberiaLithuaniaLow & middle incomeLow incomeLower middle incomeLuxembourgMacao SAR, ChinaMacedonia, FYRMadagascarMalawiMalaysiaMaliMaltaMarshall IslandsMauritaniaMauritiusMexicoMiddle East & North AfricaMiddle East & North Africa (excluding high income)Middle East & North Africa (IDA & IBRD countries)Middle incomeMoldovaMongoliaMontenegroMoroccoMozambiqueNamibiaNepalNetherlandsNew ZealandNicaraguaNigerNigeriaNorth AmericaNorwayOECD membersOmanOther small statesPakistanPanamaPapua New GuineaParaguayPeruPhilippinesPolandPortugalPost-demographic dividendPre-demographic dividendPuerto RicoQatarRomaniaRussian FederationRwandaSaudi ArabiaSenegalSerbiaSeychellesSierra LeoneSingaporeSlovak RepublicSloveniaSmall statesSomaliaSouth AfricaSouth AsiaSouth Asia (IDA & IBRD)South SudanSpainSri LankaSub-Saharan Africa Sub-Saharan Africa (excluding high income)Sub-Saharan Africa (IDA & IBRD countries)SudanSurinameSwazilandSwedenSwitzerlandSyrian Arab RepublicTajikistanTanzaniaThailandTimor-LesteTogoTrinidad and TobagoTunisiaTurkeyTurkmenistanUgandaUkraineUnited Arab EmiratesUnited KingdomUnited StatesUpper middle incomeUruguayVanuatuVenezuela, RBVietnamWest Bank and GazaWorldZambiaZimbabwe Timeline:
This timeline shows a graph from 1972 to 2016 of Luxembourg. No data until 1971. Number of actual observations by date: 45.
Source name:
World Development Indicators
Source organization:
World Bank national accounts data, and OECD National Accounts data files.
Categories, topics:
Economy & Growth
Last updated:
apr 23, 2017
Indicators value changes by year
Minimum:
-4.493
jan 1, 1993
At the date of observation
Value
Absolute change
Change from previous value
jan 1, 1972
6.427
+6.427
0.0%
jan 1, 1973
4.582
-1.845
-28.71%
jan 1, 1974
4.962
+0.38
8.3%
jan 1, 1975
1.248
-3.714
-74.86%
jan 1, 1976
6.747
+5.5
440.82%
jan 1, 1977
3.276
-3.472
-51.45%
jan 1, 1978
-0.116
-3.391
-103.53%
jan 1, 1979
5.222
+5.337
-4.61K%
jan 1, 1980
1.054
-4.167
-79.81%
jan 1, 1981
4.738
+3.683
349.38%
jan 1, 1982
2.403
-2.335
-49.28%
jan 1, 1983
0.685
-1.718
-71.51%
jan 1, 1984
-0.646
-1.331
-194.39%
jan 1, 1985
-0.314
+0.332
-51.41%
jan 1, 1986
0.782
+1.096
-349.14%
jan 1, 1987
4.999
+4.217
539.06%
jan 1, 1988
5.305
+0.306
6.12%
jan 1, 1989
5.659
+0.354
6.67%
jan 1, 1990
3.778
-1.881
-33.25%
jan 1, 1991
3.567
-0.211
-5.58%
jan 1, 1992
7.248
+3.682
103.21%
jan 1, 1993
-4.493
-11.742
-161.99%
jan 1, 1994
2.179
+6.672
-148.5%
jan 1, 1995
2.508
+0.329
15.1%
jan 1, 1996
0.625
-1.883
-75.09%
jan 1, 1997
0.353
-0.272
-43.56%
jan 1, 1998
4.173
+3.82
1.08K%
jan 1, 1999
3.908
-0.264
-6.34%
jan 1, 2000
5.599
+1.691
43.27%
jan 1, 2001
5.225
-0.375
-6.69%
jan 1, 2002
2.581
-2.644
-50.6%
jan 1, 2003
3.844
+1.263
48.93%
jan 1, 2004
2.65
-1.194
-31.06%
jan 1, 2005
-0.108
-2.758
-104.07%
jan 1, 2006
1.597
+1.705
-1.58K%
jan 1, 2007
1.858
+0.261
16.32%
jan 1, 2008
2.567
+0.709
38.17%
jan 1, 2009
0.212
-2.355
-91.74%
jan 1, 2010
1.151
+0.939
442.72%
jan 1, 2011
1.664
+0.513
44.61%
jan 1, 2012
2.186
+0.522
31.37%
jan 1, 2013
2.632
+0.446
20.43%
jan 1, 2014
1.429
-1.204
-45.73%
jan 1, 2015
3.738
+2.31
161.65%
jan 1, 2016
0.644
-3.094
-82.78%
Ranking of countries by current statistics by years


Comments: