29
/
en
AIzaSyAYiBZKx7MnpbEhh9jyipgxe19OcubqV5w
April 1, 2024
78347
Bangladesh
BGD
true
2
1
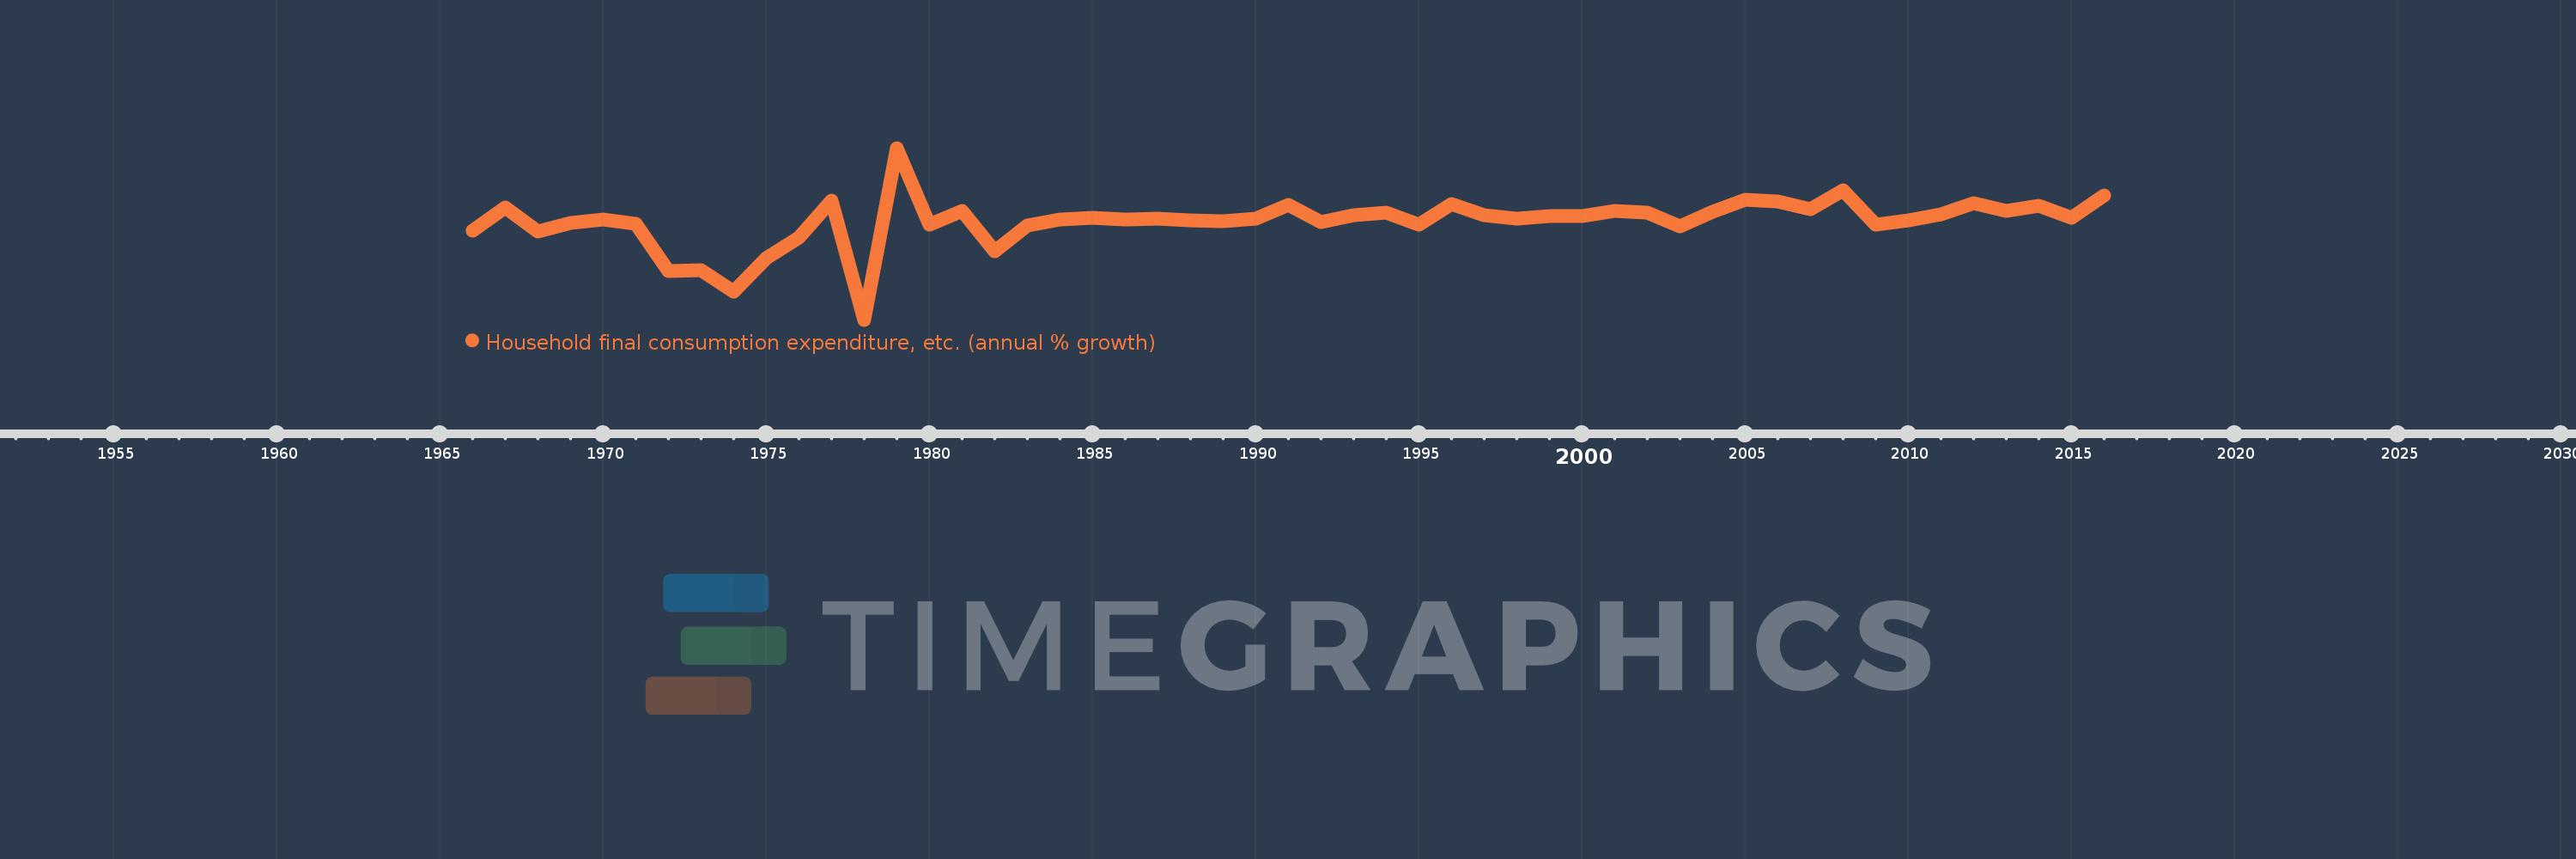
Household final consumption expenditure, etc. (annual % growth)
2016,2015,2014,2013,2012,2011,2010,2009,2008,2007,2006,2005,2004,2003,2002,2001,2000,1999,1998,1997,1996,1995,1994,1993,1992,1991,1990,1989,1988,1987,1986,1985,1984,1983,1982,1981,1980,1979,1978,1977,1976,1975,1974,1973,1972,1971,1970,1969,1968,1967,1966
This statistics in other country:
AlbaniaAlgeriaAntigua and BarbudaArab WorldArgentinaArmeniaAustraliaAustriaAzerbaijanBahamas, TheBahrainBangladeshBarbadosBelarusBelgiumBelizeBeninBhutanBoliviaBosnia and HerzegovinaBotswanaBrazilBrunei DarussalamBulgariaBurkina FasoBurundiCabo VerdeCambodiaCameroonCanadaCaribbean small statesCentral Europe and the BalticsChadChileColombiaComorosCongo, Dem. Rep.Congo, Rep.Costa RicaCote d'IvoireCroatiaCubaCyprusCzech RepublicDenmarkDjiboutiDominican RepublicEarly-demographic dividendEast Asia & PacificEcuadorEgypt, Arab Rep.El SalvadorEquatorial GuineaEritreaEstoniaEthiopiaEuro areaEurope & Central AsiaEurope & Central Asia (excluding high income)Europe & Central Asia (IDA & IBRD countries)European UnionFijiFinlandFranceGabonGambia, TheGeorgiaGermanyGhanaGreeceGuatemalaGuineaGuinea-BissauHaitiHeavily indebted poor countries (HIPC)High incomeHondurasHong Kong SAR, ChinaHungaryIBRD onlyIcelandIDA & IBRD totalIDA blendIDA onlyIDA totalIndiaIndonesiaIran, Islamic Rep.IrelandIsraelItalyJamaicaJapanJordanKazakhstanKenyaKorea, Rep.KosovoKuwaitKyrgyz RepublicLao PDRLatin America & Caribbean Latin America & Caribbean (excluding high income)Latin America & the Caribbean (IDA & IBRD countries)LatviaLeast developed countries: UN classificationLebanonLiberiaLithuaniaLow & middle incomeLow incomeLower middle incomeLuxembourgMacao SAR, ChinaMacedonia, FYRMadagascarMalawiMalaysiaMaliMaltaMarshall IslandsMauritaniaMauritiusMexicoMiddle East & North AfricaMiddle East & North Africa (excluding high income)Middle East & North Africa (IDA & IBRD countries)Middle incomeMoldovaMongoliaMontenegroMoroccoMozambiqueNamibiaNepalNetherlandsNew ZealandNicaraguaNigerNigeriaNorth AmericaNorwayOECD membersOmanOther small statesPakistanPanamaPapua New GuineaParaguayPeruPhilippinesPolandPortugalPost-demographic dividendPre-demographic dividendPuerto RicoQatarRomaniaRussian FederationRwandaSaudi ArabiaSenegalSerbiaSeychellesSierra LeoneSingaporeSlovak RepublicSloveniaSmall statesSomaliaSouth AfricaSouth AsiaSouth Asia (IDA & IBRD)South SudanSpainSri LankaSub-Saharan Africa Sub-Saharan Africa (excluding high income)Sub-Saharan Africa (IDA & IBRD countries)SudanSurinameSwazilandSwedenSwitzerlandSyrian Arab RepublicTajikistanTanzaniaThailandTimor-LesteTogoTrinidad and TobagoTunisiaTurkeyTurkmenistanUgandaUkraineUnited Arab EmiratesUnited KingdomUnited StatesUpper middle incomeUruguayVanuatuVenezuela, RBVietnamWest Bank and GazaWorldZambiaZimbabwe Timeline:
This timeline shows a graph from 1966 to 2016 of Bangladesh. No data until 1965. Number of actual observations by date: 51.
Source name:
World Development Indicators
Source organization:
World Bank national accounts data, and OECD National Accounts data files.
Categories, topics:
Economy & Growth
Last updated:
apr 23, 2017
Indicators value changes by year
Minimum:
-15.993
jan 1, 1978
Maximum:
16.689
jan 1, 1979
At the date of observation
Value
Absolute change
Change from previous value
jan 1, 1966
0.914
+0.914
0.0%
jan 1, 1967
5.307
+4.392
480.36%
jan 1, 1968
0.777
-4.529
-85.35%
jan 1, 1969
2.374
+1.597
205.37%
jan 1, 1970
3.05
+0.676
28.48%
jan 1, 1971
2.278
-0.773
-25.33%
jan 1, 1972
-6.696
-8.974
-393.99%
jan 1, 1973
-6.578
+0.118
-1.77%
jan 1, 1974
-10.624
-4.047
61.52%
jan 1, 1975
-4.297
+6.328
-59.56%
jan 1, 1976
-0.348
+3.948
-91.89%
jan 1, 1977
6.628
+6.977
-2.0K%
jan 1, 1978
-15.993
-22.621
-341.28%
jan 1, 1979
16.689
+32.682
-204.35%
jan 1, 1980
2.126
-14.563
-87.26%
jan 1, 1981
4.648
+2.523
118.66%
jan 1, 1982
-2.942
-7.59
-163.28%
jan 1, 1983
2.013
+4.954
-168.42%
jan 1, 1984
3.078
+1.065
52.9%
jan 1, 1985
3.387
+0.309
10.05%
jan 1, 1986
3.119
-0.268
-7.92%
jan 1, 1987
3.285
+0.166
5.32%
jan 1, 1988
2.873
-0.412
-12.53%
jan 1, 1989
2.778
-0.096
-3.33%
jan 1, 1990
3.209
+0.432
15.55%
jan 1, 1991
5.826
+2.616
81.52%
jan 1, 1992
2.556
-3.27
-56.12%
jan 1, 1993
3.9
+1.344
52.56%
jan 1, 1994
4.412
+0.512
13.13%
jan 1, 1995
2.068
-2.344
-53.13%
jan 1, 1996
6.098
+4.03
194.92%
jan 1, 1997
3.873
-2.225
-36.48%
jan 1, 1998
3.229
-0.644
-16.62%
jan 1, 1999
3.749
+0.519
16.08%
jan 1, 2000
3.653
-0.096
-2.56%
jan 1, 2001
4.746
+1.093
29.92%
jan 1, 2002
4.312
-0.434
-9.15%
jan 1, 2003
1.732
-2.58
-59.83%
jan 1, 2004
4.546
+2.814
162.49%
jan 1, 2005
6.874
+2.328
51.22%
jan 1, 2006
6.584
-0.29
-4.21%
jan 1, 2007
5.008
-1.576
-23.94%
jan 1, 2008
8.643
+3.635
72.58%
jan 1, 2009
2.147
-6.495
-75.15%
jan 1, 2010
2.992
+0.845
39.33%
jan 1, 2011
3.999
+1.007
33.65%
jan 1, 2012
6.249
+2.25
56.27%
jan 1, 2013
4.753
-1.496
-23.94%
jan 1, 2014
5.677
+0.924
19.45%
jan 1, 2015
3.406
-2.271
-40.01%
jan 1, 2016
7.705
+4.299
126.22%
Ranking of countries by current statistics by years


Comments: