29
/
en
AIzaSyAYiBZKx7MnpbEhh9jyipgxe19OcubqV5w
April 1, 2024
240545
Singapore
SGP
true
2
1
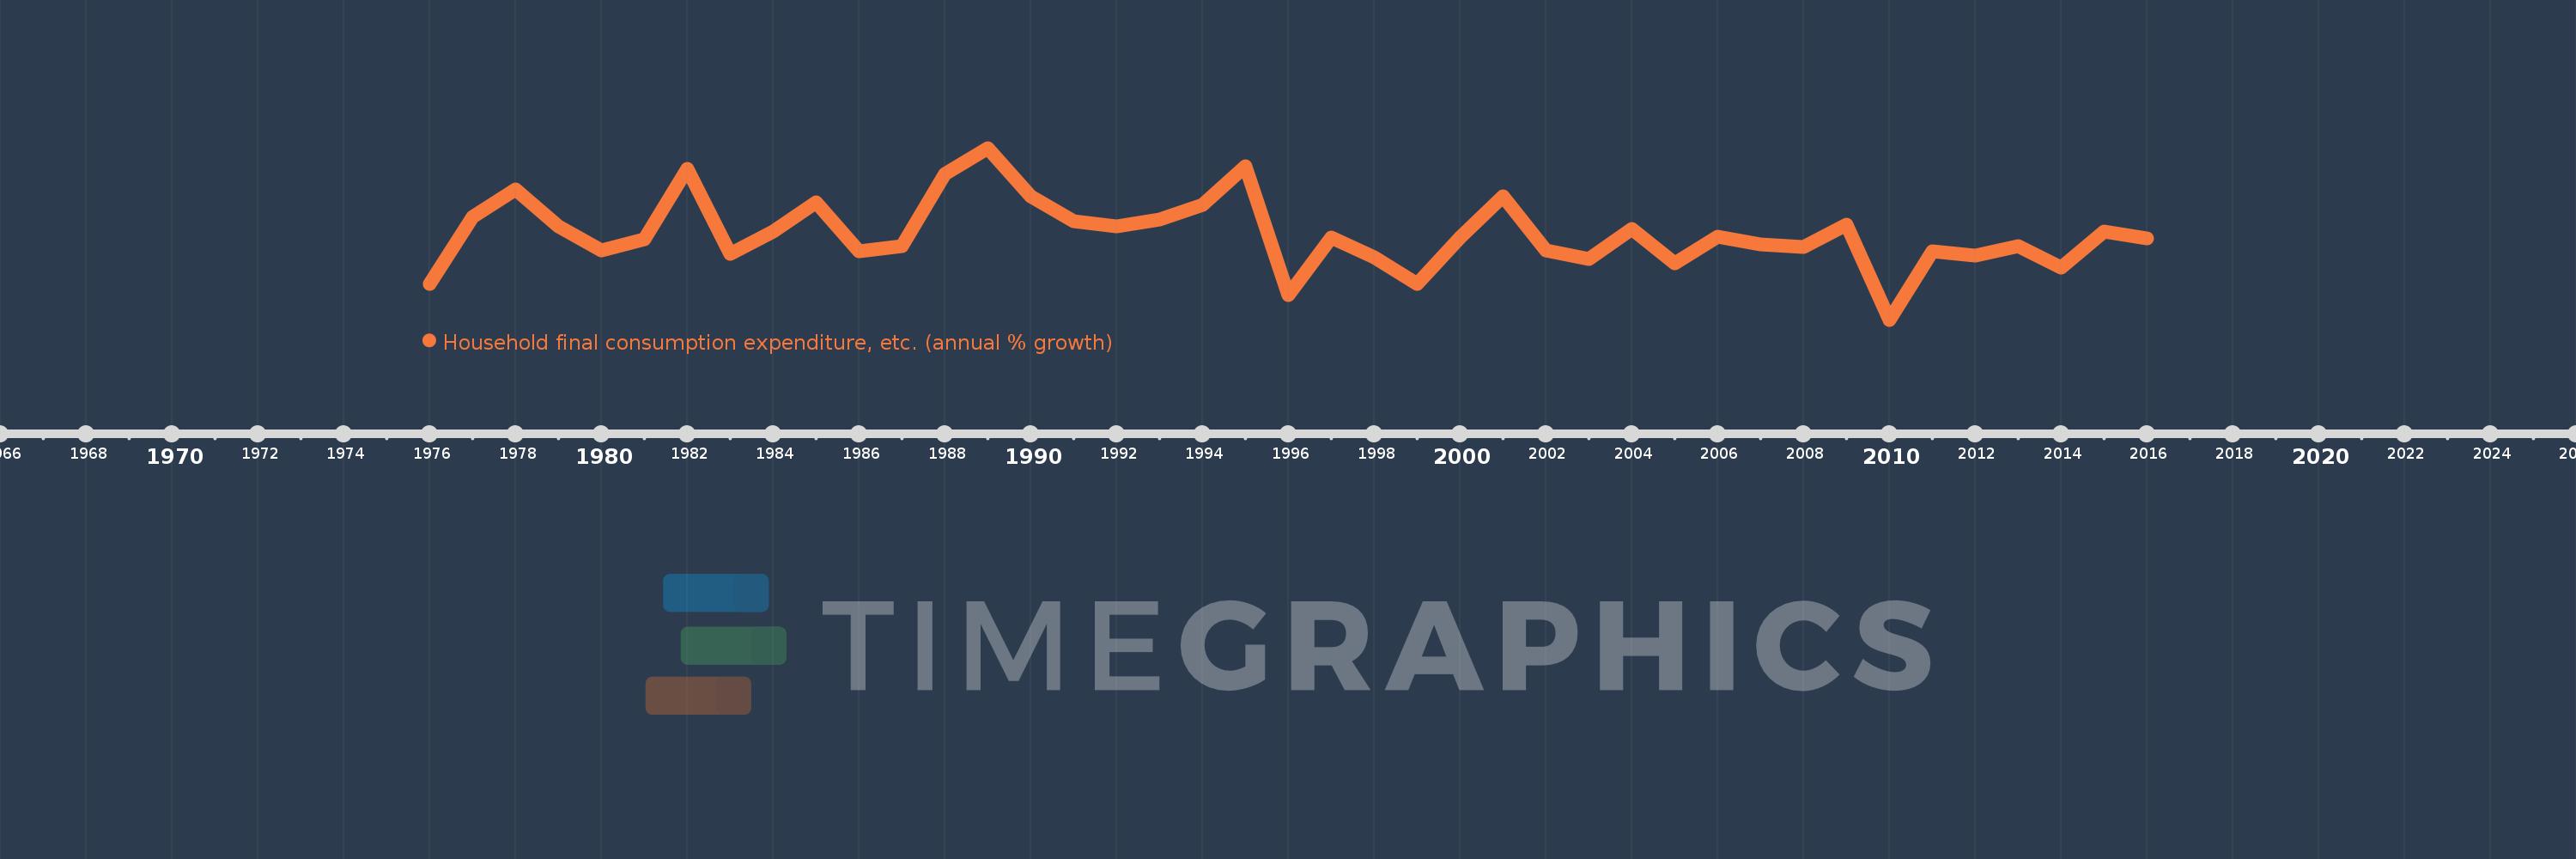
Household final consumption expenditure, etc. (annual % growth)
2016,2015,2014,2013,2012,2011,2010,2009,2008,2007,2006,2005,2004,2003,2002,2001,2000,1999,1998,1997,1996,1995,1994,1993,1992,1991,1990,1989,1988,1987,1986,1985,1984,1983,1982,1981,1980,1979,1978,1977,1976
This statistics in other country:
AlbaniaAlgeriaAntigua and BarbudaArab WorldArgentinaArmeniaAustraliaAustriaAzerbaijanBahamas, TheBahrainBangladeshBarbadosBelarusBelgiumBelizeBeninBhutanBoliviaBosnia and HerzegovinaBotswanaBrazilBrunei DarussalamBulgariaBurkina FasoBurundiCabo VerdeCambodiaCameroonCanadaCaribbean small statesCentral Europe and the BalticsChadChileColombiaComorosCongo, Dem. Rep.Congo, Rep.Costa RicaCote d'IvoireCroatiaCubaCyprusCzech RepublicDenmarkDjiboutiDominican RepublicEarly-demographic dividendEast Asia & PacificEcuadorEgypt, Arab Rep.El SalvadorEquatorial GuineaEritreaEstoniaEthiopiaEuro areaEurope & Central AsiaEurope & Central Asia (excluding high income)Europe & Central Asia (IDA & IBRD countries)European UnionFijiFinlandFranceGabonGambia, TheGeorgiaGermanyGhanaGreeceGuatemalaGuineaGuinea-BissauHaitiHeavily indebted poor countries (HIPC)High incomeHondurasHong Kong SAR, ChinaHungaryIBRD onlyIcelandIDA & IBRD totalIDA blendIDA onlyIDA totalIndiaIndonesiaIran, Islamic Rep.IrelandIsraelItalyJamaicaJapanJordanKazakhstanKenyaKorea, Rep.KosovoKuwaitKyrgyz RepublicLao PDRLatin America & Caribbean Latin America & Caribbean (excluding high income)Latin America & the Caribbean (IDA & IBRD countries)LatviaLeast developed countries: UN classificationLebanonLiberiaLithuaniaLow & middle incomeLow incomeLower middle incomeLuxembourgMacao SAR, ChinaMacedonia, FYRMadagascarMalawiMalaysiaMaliMaltaMarshall IslandsMauritaniaMauritiusMexicoMiddle East & North AfricaMiddle East & North Africa (excluding high income)Middle East & North Africa (IDA & IBRD countries)Middle incomeMoldovaMongoliaMontenegroMoroccoMozambiqueNamibiaNepalNetherlandsNew ZealandNicaraguaNigerNigeriaNorth AmericaNorwayOECD membersOmanOther small statesPakistanPanamaPapua New GuineaParaguayPeruPhilippinesPolandPortugalPost-demographic dividendPre-demographic dividendPuerto RicoQatarRomaniaRussian FederationRwandaSaudi ArabiaSenegalSerbiaSeychellesSierra LeoneSingaporeSlovak RepublicSloveniaSmall statesSomaliaSouth AfricaSouth AsiaSouth Asia (IDA & IBRD)South SudanSpainSri LankaSub-Saharan Africa Sub-Saharan Africa (excluding high income)Sub-Saharan Africa (IDA & IBRD countries)SudanSurinameSwazilandSwedenSwitzerlandSyrian Arab RepublicTajikistanTanzaniaThailandTimor-LesteTogoTrinidad and TobagoTunisiaTurkeyTurkmenistanUgandaUkraineUnited Arab EmiratesUnited KingdomUnited StatesUpper middle incomeUruguayVanuatuVenezuela, RBVietnamWest Bank and GazaWorldZambiaZimbabwe Timeline:
This timeline shows a graph from 1976 to 2016 of Singapore. No data until 1975. Number of actual observations by date: 41.
Source name:
World Development Indicators
Source organization:
World Bank national accounts data, and OECD National Accounts data files.
Categories, topics:
Economy & Growth
Last updated:
apr 23, 2017
Indicators value changes by year
Maximum:
16.224
jan 1, 1989
At the date of observation
Value
Absolute change
Change from previous value
jan 1, 1977
7.938
+7.938
%
jan 1, 1978
11.291
+3.353
42.23%
jan 1, 1979
6.885
-4.406
-39.02%
jan 1, 1980
3.988
-2.897
-42.08%
jan 1, 1981
5.306
+1.318
33.06%
jan 1, 1982
13.767
+8.462
159.47%
jan 1, 1983
3.561
-10.206
-74.13%
jan 1, 1984
6.281
+2.72
76.37%
jan 1, 1985
9.687
+3.406
54.23%
jan 1, 1986
3.908
-5.779
-59.66%
jan 1, 1987
4.477
+0.569
14.55%
jan 1, 1988
13.122
+8.645
193.12%
jan 1, 1989
16.224
+3.102
23.64%
jan 1, 1990
10.434
-5.79
-35.69%
jan 1, 1991
7.52
-2.914
-27.93%
jan 1, 1992
6.821
-0.699
-9.3%
jan 1, 1993
7.685
+0.864
12.67%
jan 1, 1994
9.414
+1.729
22.5%
jan 1, 1995
14.072
+4.659
49.49%
jan 1, 1996
-1.305
-15.377
-109.27%
jan 1, 1997
5.514
+6.819
-522.65%
jan 1, 1998
3.21
-2.305
-41.79%
jan 1, 1999
-0.057
-3.266
-101.77%
jan 1, 2000
5.497
+5.554
-9.79K%
jan 1, 2001
10.405
+4.908
89.29%
jan 1, 2002
4.03
-6.375
-61.27%
jan 1, 2003
2.935
-1.095
-27.17%
jan 1, 2004
6.582
+3.647
124.24%
jan 1, 2005
2.487
-4.095
-62.22%
jan 1, 2006
5.668
+3.181
127.92%
jan 1, 2007
4.717
-0.951
-16.79%
jan 1, 2008
4.409
-0.307
-6.51%
jan 1, 2009
7.031
+2.622
59.46%
jan 1, 2010
-4.3
-11.331
-161.15%
jan 1, 2011
3.884
+8.183
-190.33%
jan 1, 2012
3.354
-0.53
-13.65%
jan 1, 2013
4.522
+1.168
34.82%
jan 1, 2014
1.971
-2.55
-56.4%
jan 1, 2015
6.242
+4.27
216.61%
jan 1, 2016
5.425
-0.817
-13.09%
Ranking of countries by current statistics by years


Comments: