29
/
en
AIzaSyAYiBZKx7MnpbEhh9jyipgxe19OcubqV5w
April 1, 2024
255277
Swaziland
SWZ
true
2
1
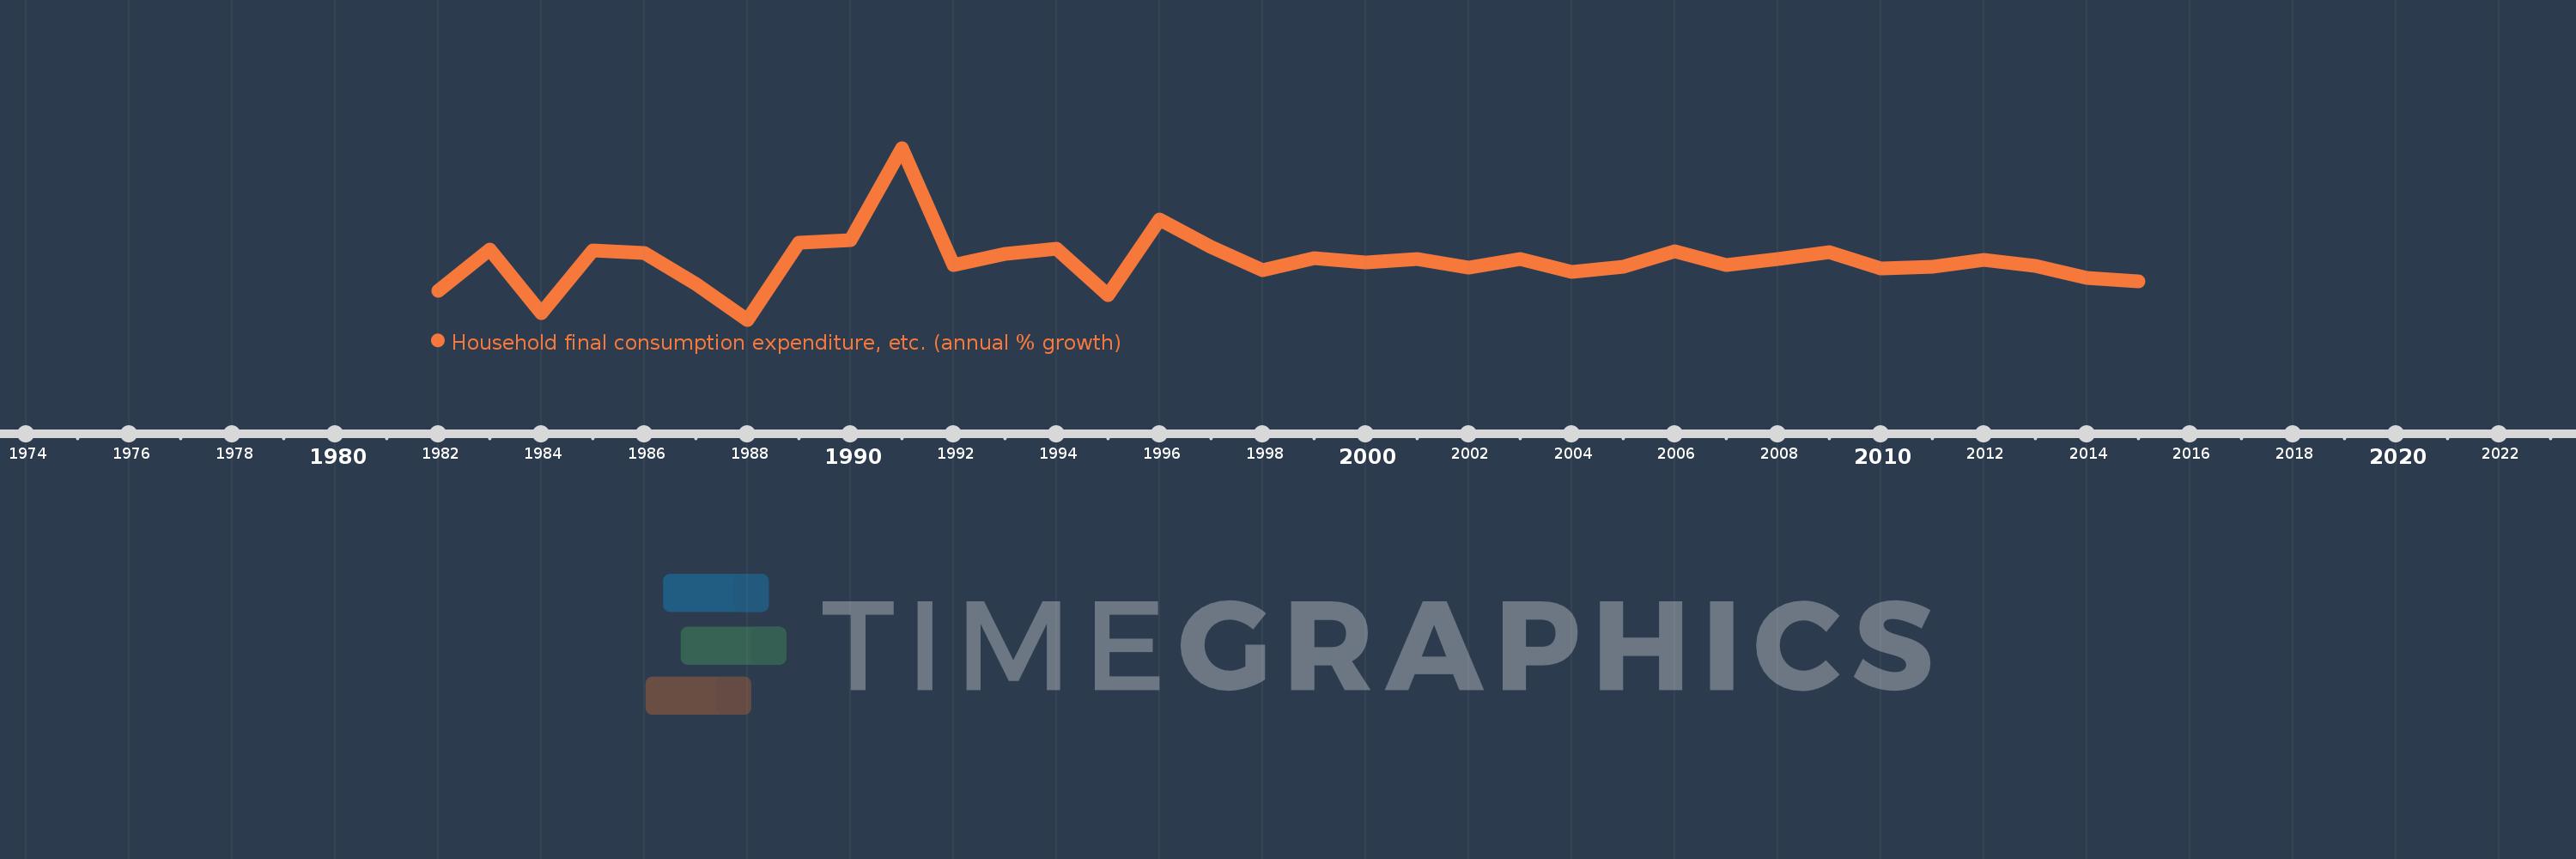
Household final consumption expenditure, etc. (annual % growth)
2015,2014,2013,2012,2011,2010,2009,2008,2007,2006,2005,2004,2003,2002,2001,2000,1999,1998,1997,1996,1995,1994,1993,1992,1991,1990,1989,1988,1987,1986,1985,1984,1983,1982
This statistics in other country:
AlbaniaAlgeriaAntigua and BarbudaArab WorldArgentinaArmeniaAustraliaAustriaAzerbaijanBahamas, TheBahrainBangladeshBarbadosBelarusBelgiumBelizeBeninBhutanBoliviaBosnia and HerzegovinaBotswanaBrazilBrunei DarussalamBulgariaBurkina FasoBurundiCabo VerdeCambodiaCameroonCanadaCaribbean small statesCentral Europe and the BalticsChadChileColombiaComorosCongo, Dem. Rep.Congo, Rep.Costa RicaCote d'IvoireCroatiaCubaCyprusCzech RepublicDenmarkDjiboutiDominican RepublicEarly-demographic dividendEast Asia & PacificEcuadorEgypt, Arab Rep.El SalvadorEquatorial GuineaEritreaEstoniaEthiopiaEuro areaEurope & Central AsiaEurope & Central Asia (excluding high income)Europe & Central Asia (IDA & IBRD countries)European UnionFijiFinlandFranceGabonGambia, TheGeorgiaGermanyGhanaGreeceGuatemalaGuineaGuinea-BissauHaitiHeavily indebted poor countries (HIPC)High incomeHondurasHong Kong SAR, ChinaHungaryIBRD onlyIcelandIDA & IBRD totalIDA blendIDA onlyIDA totalIndiaIndonesiaIran, Islamic Rep.IrelandIsraelItalyJamaicaJapanJordanKazakhstanKenyaKorea, Rep.KosovoKuwaitKyrgyz RepublicLao PDRLatin America & Caribbean Latin America & Caribbean (excluding high income)Latin America & the Caribbean (IDA & IBRD countries)LatviaLeast developed countries: UN classificationLebanonLiberiaLithuaniaLow & middle incomeLow incomeLower middle incomeLuxembourgMacao SAR, ChinaMacedonia, FYRMadagascarMalawiMalaysiaMaliMaltaMarshall IslandsMauritaniaMauritiusMexicoMiddle East & North AfricaMiddle East & North Africa (excluding high income)Middle East & North Africa (IDA & IBRD countries)Middle incomeMoldovaMongoliaMontenegroMoroccoMozambiqueNamibiaNepalNetherlandsNew ZealandNicaraguaNigerNigeriaNorth AmericaNorwayOECD membersOmanOther small statesPakistanPanamaPapua New GuineaParaguayPeruPhilippinesPolandPortugalPost-demographic dividendPre-demographic dividendPuerto RicoQatarRomaniaRussian FederationRwandaSaudi ArabiaSenegalSerbiaSeychellesSierra LeoneSingaporeSlovak RepublicSloveniaSmall statesSomaliaSouth AfricaSouth AsiaSouth Asia (IDA & IBRD)South SudanSpainSri LankaSub-Saharan Africa Sub-Saharan Africa (excluding high income)Sub-Saharan Africa (IDA & IBRD countries)SudanSurinameSwazilandSwedenSwitzerlandSyrian Arab RepublicTajikistanTanzaniaThailandTimor-LesteTogoTrinidad and TobagoTunisiaTurkeyTurkmenistanUgandaUkraineUnited Arab EmiratesUnited KingdomUnited StatesUpper middle incomeUruguayVanuatuVenezuela, RBVietnamWest Bank and GazaWorldZambiaZimbabwe Timeline:
This timeline shows a graph from 1982 to 2015 of Swaziland. No data until 1981. Number of actual observations by date: 34.
Source name:
World Development Indicators
Source organization:
World Bank national accounts data, and OECD National Accounts data files.
Categories, topics:
Economy & Growth
Last updated:
apr 23, 2017
Indicators value changes by year
Minimum:
-24.011
jan 1, 1988
Maximum:
60.267
jan 1, 1991
At the date of observation
Value
Absolute change
Change from previous value
jan 1, 1982
-9.971
-9.971
0.0%
jan 1, 1983
10.359
+20.33
-203.9%
jan 1, 1984
-20.7
-31.06
-299.82%
jan 1, 1985
10.041
+30.741
-148.51%
jan 1, 1986
8.866
-1.175
-11.7%
jan 1, 1987
-6.407
-15.273
-172.26%
jan 1, 1988
-24.011
-17.604
274.76%
jan 1, 1989
13.776
+37.787
-157.38%
jan 1, 1990
14.921
+1.145
8.31%
jan 1, 1991
60.267
+45.346
303.9%
jan 1, 1992
2.944
-57.323
-95.11%
jan 1, 1993
8.468
+5.523
187.6%
jan 1, 1994
10.856
+2.388
28.21%
jan 1, 1995
-12.067
-22.923
-211.16%
jan 1, 1996
25.182
+37.249
-308.68%
jan 1, 1997
11.864
-13.318
-52.89%
jan 1, 1998
0.436
-11.427
-96.32%
jan 1, 1999
6.248
+5.812
1.33K%
jan 1, 2000
4.097
-2.151
-34.43%
jan 1, 2001
5.811
+1.714
41.83%
jan 1, 2002
1.617
-4.194
-72.18%
jan 1, 2003
5.698
+4.081
252.47%
jan 1, 2004
-0.716
-6.414
-112.57%
jan 1, 2005
2.165
+2.882
-402.29%
jan 1, 2006
9.422
+7.257
335.12%
jan 1, 2007
2.989
-6.433
-68.27%
jan 1, 2008
5.826
+2.837
94.9%
jan 1, 2009
9.267
+3.441
59.06%
jan 1, 2010
1.324
-7.944
-85.72%
jan 1, 2011
1.782
+0.459
34.64%
jan 1, 2012
5.546
+3.764
211.16%
jan 1, 2013
2.268
-3.278
-59.11%
jan 1, 2014
-3.28
-5.548
-244.65%
jan 1, 2015
-5.314
-2.034
62.02%
Ranking of countries by current statistics by years


Comments: