29
/
en
AIzaSyAYiBZKx7MnpbEhh9jyipgxe19OcubqV5w
April 1, 2024
281077
Venezuela, RB
VEN
true
2
1
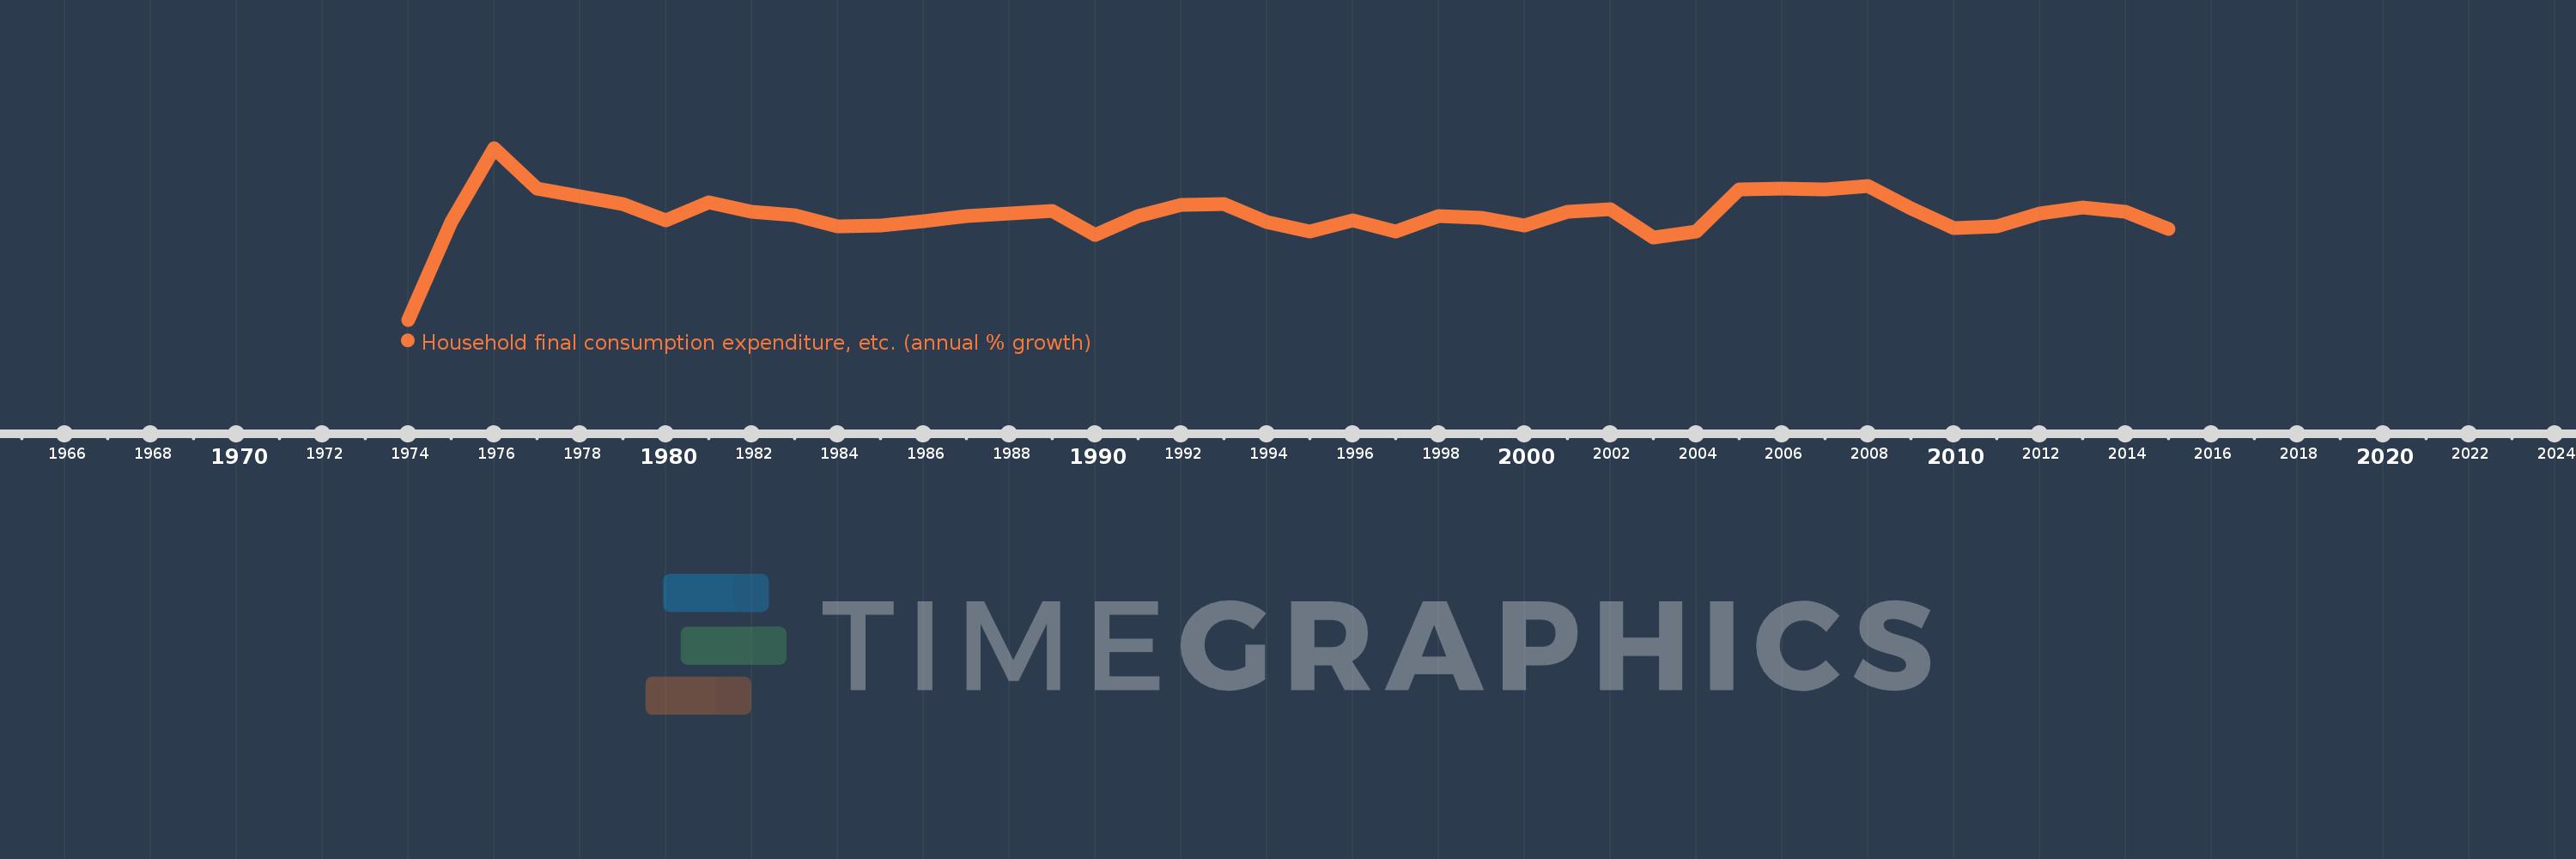
Household final consumption expenditure, etc. (annual % growth)
2015,2014,2013,2012,2011,2010,2009,2008,2007,2006,2005,2004,2003,2002,2001,2000,1999,1998,1997,1996,1995,1994,1993,1992,1991,1990,1989,1988,1987,1986,1985,1984,1983,1982,1981,1980,1979,1978,1977,1976,1975,1974
This statistics in other country:
AlbaniaAlgeriaAntigua and BarbudaArab WorldArgentinaArmeniaAustraliaAustriaAzerbaijanBahamas, TheBahrainBangladeshBarbadosBelarusBelgiumBelizeBeninBhutanBoliviaBosnia and HerzegovinaBotswanaBrazilBrunei DarussalamBulgariaBurkina FasoBurundiCabo VerdeCambodiaCameroonCanadaCaribbean small statesCentral Europe and the BalticsChadChileColombiaComorosCongo, Dem. Rep.Congo, Rep.Costa RicaCote d'IvoireCroatiaCubaCyprusCzech RepublicDenmarkDjiboutiDominican RepublicEarly-demographic dividendEast Asia & PacificEcuadorEgypt, Arab Rep.El SalvadorEquatorial GuineaEritreaEstoniaEthiopiaEuro areaEurope & Central AsiaEurope & Central Asia (excluding high income)Europe & Central Asia (IDA & IBRD countries)European UnionFijiFinlandFranceGabonGambia, TheGeorgiaGermanyGhanaGreeceGuatemalaGuineaGuinea-BissauHaitiHeavily indebted poor countries (HIPC)High incomeHondurasHong Kong SAR, ChinaHungaryIBRD onlyIcelandIDA & IBRD totalIDA blendIDA onlyIDA totalIndiaIndonesiaIran, Islamic Rep.IrelandIsraelItalyJamaicaJapanJordanKazakhstanKenyaKorea, Rep.KosovoKuwaitKyrgyz RepublicLao PDRLatin America & Caribbean Latin America & Caribbean (excluding high income)Latin America & the Caribbean (IDA & IBRD countries)LatviaLeast developed countries: UN classificationLebanonLiberiaLithuaniaLow & middle incomeLow incomeLower middle incomeLuxembourgMacao SAR, ChinaMacedonia, FYRMadagascarMalawiMalaysiaMaliMaltaMarshall IslandsMauritaniaMauritiusMexicoMiddle East & North AfricaMiddle East & North Africa (excluding high income)Middle East & North Africa (IDA & IBRD countries)Middle incomeMoldovaMongoliaMontenegroMoroccoMozambiqueNamibiaNepalNetherlandsNew ZealandNicaraguaNigerNigeriaNorth AmericaNorwayOECD membersOmanOther small statesPakistanPanamaPapua New GuineaParaguayPeruPhilippinesPolandPortugalPost-demographic dividendPre-demographic dividendPuerto RicoQatarRomaniaRussian FederationRwandaSaudi ArabiaSenegalSerbiaSeychellesSierra LeoneSingaporeSlovak RepublicSloveniaSmall statesSomaliaSouth AfricaSouth AsiaSouth Asia (IDA & IBRD)South SudanSpainSri LankaSub-Saharan Africa Sub-Saharan Africa (excluding high income)Sub-Saharan Africa (IDA & IBRD countries)SudanSurinameSwazilandSwedenSwitzerlandSyrian Arab RepublicTajikistanTanzaniaThailandTimor-LesteTogoTrinidad and TobagoTunisiaTurkeyTurkmenistanUgandaUkraineUnited Arab EmiratesUnited KingdomUnited StatesUpper middle incomeUruguayVanuatuVenezuela, RBVietnamWest Bank and GazaWorldZambiaZimbabwe Timeline:
This timeline shows a graph from 1974 to 2015 of Venezuela, RB. No data until 1973. Number of actual observations by date: 42.
Source name:
World Development Indicators
Source organization:
World Bank national accounts data, and OECD National Accounts data files.
Categories, topics:
Economy & Growth
Last updated:
apr 23, 2017
Indicators value changes by year
Minimum:
-45.722
jan 1, 1974
Maximum:
34.709
jan 1, 1976
At the date of observation
Value
Absolute change
Change from previous value
jan 1, 1974
-45.722
-45.722
0.0%
jan 1, 1975
0.0
+45.722
-100.0%
jan 1, 1976
34.709
+34.709
%
jan 1, 1977
15.697
-19.012
-54.77%
jan 1, 1978
12.108
-3.589
-22.87%
jan 1, 1979
8.341
-3.767
-31.11%
jan 1, 1980
0.623
-7.718
-92.53%
jan 1, 1981
9.199
+8.576
1.38K%
jan 1, 1982
4.658
-4.542
-49.37%
jan 1, 1983
3.251
-1.407
-30.21%
jan 1, 1984
-2.174
-5.425
-166.87%
jan 1, 1985
-1.79
+0.384
-17.64%
jan 1, 1986
0.246
+2.037
-113.75%
jan 1, 1987
2.962
+2.716
1.1K%
jan 1, 1988
3.991
+1.029
34.74%
jan 1, 1989
5.046
+1.055
26.42%
jan 1, 1990
-5.958
-11.004
-218.08%
jan 1, 1991
2.869
+8.827
-148.15%
jan 1, 1992
7.976
+5.108
178.04%
jan 1, 1993
8.32
+0.343
4.3%
jan 1, 1994
0.103
-8.216
-98.76%
jan 1, 1995
-4.452
-4.555
-4.41K%
jan 1, 1996
0.943
+5.394
-121.17%
jan 1, 1997
-4.405
-5.348
-567.37%
jan 1, 1998
2.688
+7.093
-161.01%
jan 1, 1999
1.837
-0.851
-31.64%
jan 1, 2000
-1.705
-3.543
-192.82%
jan 1, 2001
4.685
+6.39
-374.71%
jan 1, 2002
5.99
+1.305
27.85%
jan 1, 2003
-7.108
-13.097
-218.67%
jan 1, 2004
-4.263
+2.845
-40.03%
jan 1, 2005
15.448
+19.71
-462.38%
jan 1, 2006
15.713
+0.265
1.72%
jan 1, 2007
15.457
-0.255
-1.62%
jan 1, 2008
16.886
+1.429
9.24%
jan 1, 2009
6.317
-10.569
-62.59%
jan 1, 2010
-2.924
-9.24
-146.28%
jan 1, 2011
-1.868
+1.055
-36.1%
jan 1, 2012
4.024
+5.892
-315.4%
jan 1, 2013
7.024
+3.0
74.55%
jan 1, 2014
4.723
-2.301
-32.76%
jan 1, 2015
-3.362
-8.085
-171.19%
Ranking of countries by current statistics by years


Comments: