29
/
en
AIzaSyAYiBZKx7MnpbEhh9jyipgxe19OcubqV5w
April 1, 2024
122229
Dominican Republic
DOM
true
2
1
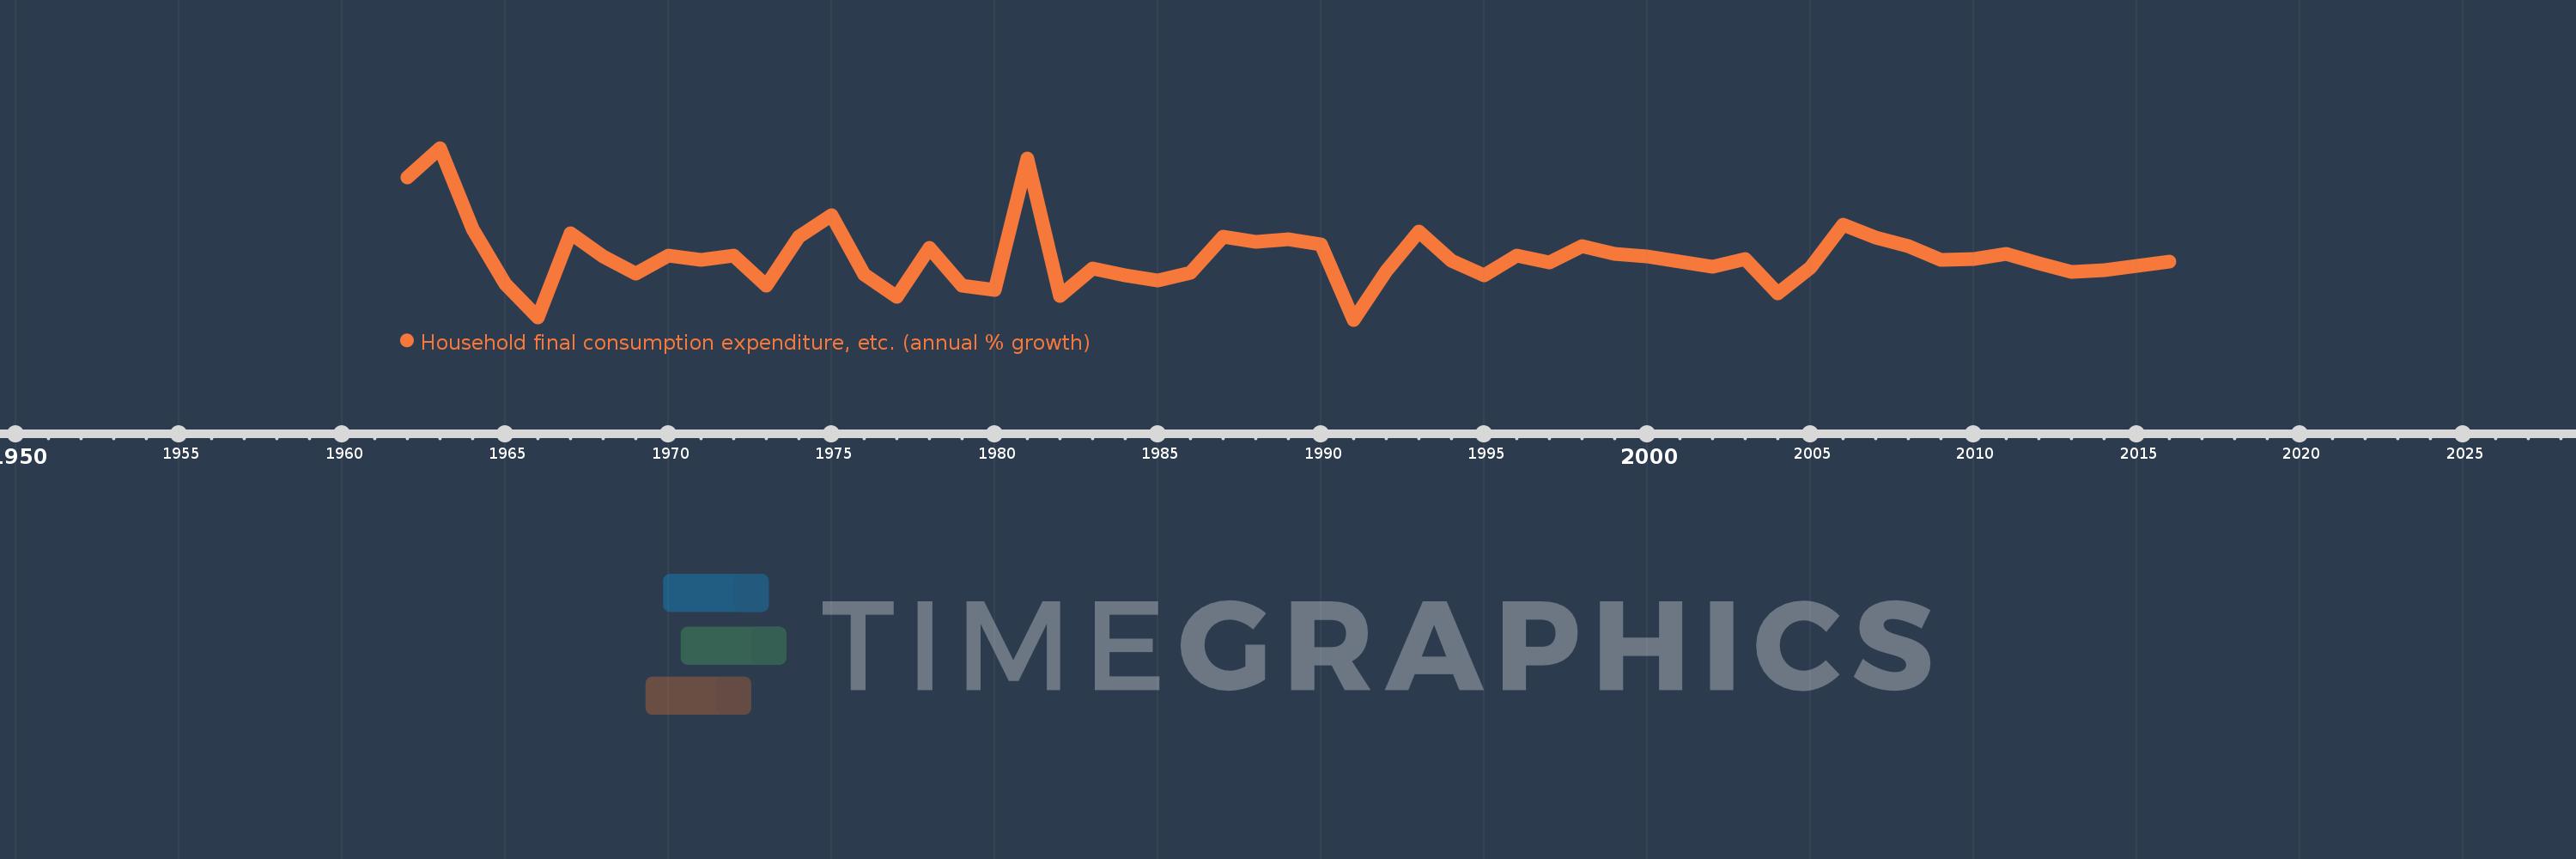
Household final consumption expenditure, etc. (annual % growth)
2016,2015,2014,2013,2012,2011,2010,2009,2008,2007,2006,2005,2004,2003,2002,2001,2000,1999,1998,1997,1996,1995,1994,1993,1992,1991,1990,1989,1988,1987,1986,1985,1984,1983,1982,1981,1980,1979,1978,1977,1976,1975,1974,1973,1972,1971,1970,1969,1968,1967,1966,1965,1964,1963,1962
This statistics in other country:
AlbaniaAlgeriaAntigua and BarbudaArab WorldArgentinaArmeniaAustraliaAustriaAzerbaijanBahamas, TheBahrainBangladeshBarbadosBelarusBelgiumBelizeBeninBhutanBoliviaBosnia and HerzegovinaBotswanaBrazilBrunei DarussalamBulgariaBurkina FasoBurundiCabo VerdeCambodiaCameroonCanadaCaribbean small statesCentral Europe and the BalticsChadChileColombiaComorosCongo, Dem. Rep.Congo, Rep.Costa RicaCote d'IvoireCroatiaCubaCyprusCzech RepublicDenmarkDjiboutiDominican RepublicEarly-demographic dividendEast Asia & PacificEcuadorEgypt, Arab Rep.El SalvadorEquatorial GuineaEritreaEstoniaEthiopiaEuro areaEurope & Central AsiaEurope & Central Asia (excluding high income)Europe & Central Asia (IDA & IBRD countries)European UnionFijiFinlandFranceGabonGambia, TheGeorgiaGermanyGhanaGreeceGuatemalaGuineaGuinea-BissauHaitiHeavily indebted poor countries (HIPC)High incomeHondurasHong Kong SAR, ChinaHungaryIBRD onlyIcelandIDA & IBRD totalIDA blendIDA onlyIDA totalIndiaIndonesiaIran, Islamic Rep.IrelandIsraelItalyJamaicaJapanJordanKazakhstanKenyaKorea, Rep.KosovoKuwaitKyrgyz RepublicLao PDRLatin America & Caribbean Latin America & Caribbean (excluding high income)Latin America & the Caribbean (IDA & IBRD countries)LatviaLeast developed countries: UN classificationLebanonLiberiaLithuaniaLow & middle incomeLow incomeLower middle incomeLuxembourgMacao SAR, ChinaMacedonia, FYRMadagascarMalawiMalaysiaMaliMaltaMarshall IslandsMauritaniaMauritiusMexicoMiddle East & North AfricaMiddle East & North Africa (excluding high income)Middle East & North Africa (IDA & IBRD countries)Middle incomeMoldovaMongoliaMontenegroMoroccoMozambiqueNamibiaNepalNetherlandsNew ZealandNicaraguaNigerNigeriaNorth AmericaNorwayOECD membersOmanOther small statesPakistanPanamaPapua New GuineaParaguayPeruPhilippinesPolandPortugalPost-demographic dividendPre-demographic dividendPuerto RicoQatarRomaniaRussian FederationRwandaSaudi ArabiaSenegalSerbiaSeychellesSierra LeoneSingaporeSlovak RepublicSloveniaSmall statesSomaliaSouth AfricaSouth AsiaSouth Asia (IDA & IBRD)South SudanSpainSri LankaSub-Saharan Africa Sub-Saharan Africa (excluding high income)Sub-Saharan Africa (IDA & IBRD countries)SudanSurinameSwazilandSwedenSwitzerlandSyrian Arab RepublicTajikistanTanzaniaThailandTimor-LesteTogoTrinidad and TobagoTunisiaTurkeyTurkmenistanUgandaUkraineUnited Arab EmiratesUnited KingdomUnited StatesUpper middle incomeUruguayVanuatuVenezuela, RBVietnamWest Bank and GazaWorldZambiaZimbabwe Timeline:
This timeline shows a graph from 1962 to 2016 of Dominican Republic. No data until 1961. Number of actual observations by date: 55.
Source name:
World Development Indicators
Source organization:
World Bank national accounts data, and OECD National Accounts data files.
Categories, topics:
Economy & Growth
Last updated:
apr 23, 2017
Indicators value changes by year
Minimum:
-12.394
jan 1, 1991
Maximum:
38.442
jan 1, 1963
At the date of observation
Value
Absolute change
Change from previous value
jan 1, 1962
29.649
+29.649
0.0%
jan 1, 1963
38.442
+8.793
29.66%
jan 1, 1964
14.539
-23.903
-62.18%
jan 1, 1965
-1.764
-16.303
-112.13%
jan 1, 1966
-11.748
-9.984
565.97%
jan 1, 1967
13.218
+24.966
-212.51%
jan 1, 1968
6.224
-6.994
-52.91%
jan 1, 1969
1.185
-5.039
-80.96%
jan 1, 1970
6.606
+5.421
457.58%
jan 1, 1971
5.423
-1.183
-17.9%
jan 1, 1972
6.671
+1.248
23.01%
jan 1, 1973
-2.421
-9.092
-136.29%
jan 1, 1974
12.217
+14.638
-604.66%
jan 1, 1975
18.468
+6.251
51.17%
jan 1, 1976
1.055
-17.413
-94.29%
jan 1, 1977
-5.641
-6.696
-634.93%
jan 1, 1978
8.974
+14.615
-259.07%
jan 1, 1979
-2.342
-11.316
-126.09%
jan 1, 1980
-3.671
-1.329
56.76%
jan 1, 1981
35.407
+39.078
-1.06K%
jan 1, 1982
-5.449
-40.856
-115.39%
jan 1, 1983
2.82
+8.268
-151.75%
jan 1, 1984
0.835
-1.984
-70.37%
jan 1, 1985
-0.851
-1.687
-201.92%
jan 1, 1986
1.531
+2.382
-279.77%
jan 1, 1987
12.172
+10.642
695.3%
jan 1, 1988
10.64
-1.532
-12.59%
jan 1, 1989
11.302
+0.662
6.22%
jan 1, 1990
9.937
-1.365
-12.08%
jan 1, 1991
-12.394
-22.33
-224.73%
jan 1, 1992
2.115
+14.509
-117.07%
jan 1, 1993
13.707
+11.591
547.95%
jan 1, 1994
5.026
-8.681
-63.33%
jan 1, 1995
0.838
-4.188
-83.32%
jan 1, 1996
6.679
+5.84
696.73%
jan 1, 1997
4.469
-2.209
-33.08%
jan 1, 1998
9.449
+4.98
111.43%
jan 1, 1999
6.989
-2.461
-26.04%
jan 1, 2000
6.347
-0.642
-9.18%
jan 1, 2001
4.738
-1.609
-25.35%
jan 1, 2002
3.251
-1.487
-31.38%
jan 1, 2003
5.551
+2.3
70.74%
jan 1, 2004
-4.586
-10.136
-182.61%
jan 1, 2005
3.053
+7.639
-166.58%
jan 1, 2006
15.667
+12.614
413.14%
jan 1, 2007
12.005
-3.662
-23.37%
jan 1, 2008
9.494
-2.511
-20.92%
jan 1, 2009
5.443
-4.052
-42.67%
jan 1, 2010
5.595
+0.152
2.79%
jan 1, 2011
7.02
+1.425
25.48%
jan 1, 2012
4.367
-2.653
-37.79%
jan 1, 2013
1.876
-2.491
-57.04%
jan 1, 2014
2.305
+0.429
22.88%
jan 1, 2015
3.562
+1.257
54.54%
jan 1, 2016
4.845
+1.283
36.0%
Ranking of countries by current statistics by years


Comments: