29
/
en
AIzaSyAYiBZKx7MnpbEhh9jyipgxe19OcubqV5w
April 1, 2024
93846
Bulgaria
BGR
true
2
1
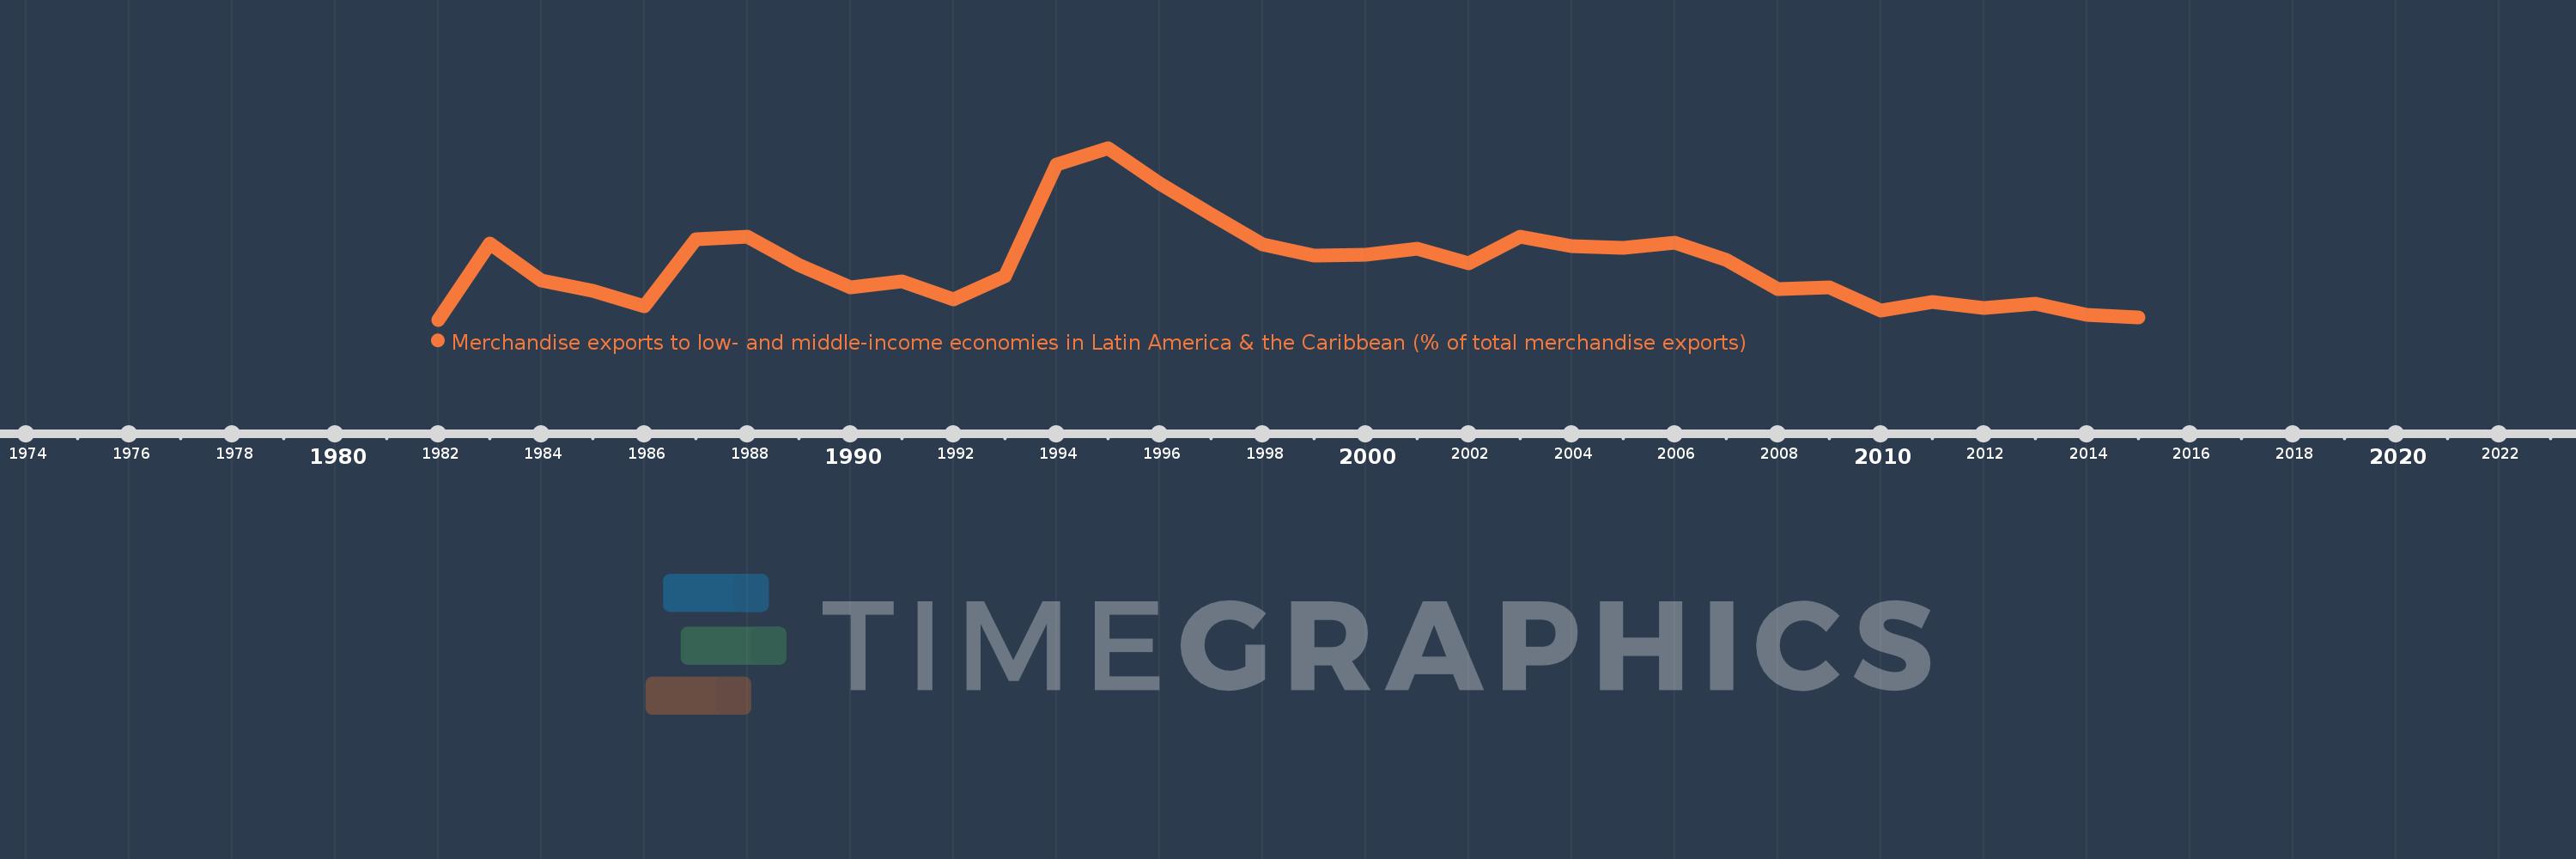
Merchandise exports to low- and middle-income economies in Latin America & the Caribbean (% of total merchandise exports)
2015,2014,2013,2012,2011,2010,2009,2008,2007,2006,2005,2004,2003,2002,2001,2000,1999,1998,1997,1996,1995,1994,1993,1992,1991,1990,1989,1988,1987,1986,1985,1984,1983,1982
This statistics in other country:
AfghanistanAlbaniaAlgeriaAngolaAntigua and BarbudaArab WorldArgentinaArmeniaArubaAustraliaAustriaAzerbaijanBahamas, TheBahrainBangladeshBarbadosBelarusBelgiumBelizeBeninBermudaBoliviaBrazilBrunei DarussalamBulgariaBurundiCabo VerdeCambodiaCameroonCanadaCaribbean small statesCentral African RepublicCentral Europe and the BalticsChileChinaColombiaCongo, Dem. Rep.Congo, Rep.Costa RicaCote d'IvoireCroatiaCubaCyprusCzech RepublicDenmarkDominicaDominican RepublicEarly-demographic dividendEast Asia & PacificEast Asia & Pacific (excluding high income)East Asia & Pacific (IDA & IBRD countries)EcuadorEgypt, Arab Rep.El SalvadorEstoniaEthiopiaEuro areaEurope & Central AsiaEurope & Central Asia (excluding high income)Europe & Central Asia (IDA & IBRD countries)European UnionFaroe IslandsFijiFinlandFragile and conflict affected situationsFranceFrench PolynesiaGabonGambia, TheGeorgiaGermanyGhanaGibraltarGreeceGreenlandGrenadaGuatemalaGuineaGuyanaHaitiHeavily indebted poor countries (HIPC)High incomeHondurasHong Kong SAR, ChinaHungaryIBRD onlyIcelandIDA & IBRD totalIDA blendIDA onlyIDA totalIndiaIndonesiaIran, Islamic Rep.IraqIrelandIsraelItalyJamaicaJapanJordanKazakhstanKenyaKorea, Dem. People’s Rep.Korea, Rep.KuwaitLao PDRLate-demographic dividendLatin America & Caribbean Latin America & Caribbean (excluding high income)Latin America & the Caribbean (IDA & IBRD countries)LatviaLeast developed countries: UN classificationLebanonLiberiaLibyaLithuaniaLow & middle incomeLow incomeLower middle incomeLuxembourgMacao SAR, ChinaMacedonia, FYRMadagascarMalawiMalaysiaMaliMaltaMauritaniaMauritiusMexicoMiddle East & North AfricaMiddle East & North Africa (excluding high income)Middle East & North Africa (IDA & IBRD countries)Middle incomeMongoliaMontenegroMoroccoMozambiqueMyanmarNetherlandsNew CaledoniaNew ZealandNicaraguaNigerNigeriaNorth AmericaNorwayOECD membersOmanOther small statesPacific island small statesPakistanPanamaPapua New GuineaParaguayPeruPhilippinesPolandPortugalPost-demographic dividendPre-demographic dividendQatarRomaniaRussian FederationRwandaSamoaSaudi ArabiaSenegalSerbiaSierra LeoneSingaporeSlovak RepublicSloveniaSmall statesSomaliaSouth AfricaSouth AsiaSouth Asia (IDA & IBRD)SpainSri LankaSt. Kitts and NevisSt. LuciaSt. Vincent and the GrenadinesSub-Saharan Africa Sub-Saharan Africa (excluding high income)Sub-Saharan Africa (IDA & IBRD countries)SudanSurinameSwedenSwitzerlandSyrian Arab RepublicTanzaniaThailandTogoTrinidad and TobagoTunisiaTurkeyUgandaUkraineUnited Arab EmiratesUnited KingdomUnited StatesUpper middle incomeUruguayVenezuela, RBVietnamWorldYemen, Rep.ZambiaZimbabwe Timeline:
This timeline shows a graph from 1982 to 2015 of Bulgaria. No data until 1981. Number of actual observations by date: 34.
Source name:
World Development Indicators
Source organization:
World Bank staff estimates based data from International Monetary Fund's Direction of Trade database.
Categories, topics:
Private Sector, Trade
Last updated:
apr 23, 2017
Indicators value changes by year
At the date of observation
Value
Absolute change
Change from previous value
jan 1, 1982
0.255
+0.255
0.0%
jan 1, 1983
0.904
+0.649
254.78%
jan 1, 1984
0.587
-0.317
-35.03%
jan 1, 1985
0.5
-0.087
-14.82%
jan 1, 1986
0.37
-0.131
-26.11%
jan 1, 1987
0.939
+0.569
153.96%
jan 1, 1988
0.957
+0.018
1.92%
jan 1, 1989
0.721
-0.236
-24.63%
jan 1, 1990
0.528
-0.194
-26.84%
jan 1, 1991
0.577
+0.049
9.33%
jan 1, 1992
0.424
-0.153
-26.54%
jan 1, 1993
0.622
+0.198
46.68%
jan 1, 1994
1.572
+0.95
152.82%
jan 1, 1995
1.711
+0.139
8.86%
jan 1, 1996
1.41
-0.301
-17.59%
jan 1, 1997
1.145
-0.265
-18.78%
jan 1, 1998
0.89
-0.255
-22.24%
jan 1, 1999
0.802
-0.089
-9.97%
jan 1, 2000
0.807
+0.005
0.68%
jan 1, 2001
0.855
+0.048
5.96%
jan 1, 2002
0.736
-0.12
-13.98%
jan 1, 2003
0.961
+0.226
30.69%
jan 1, 2004
0.876
-0.085
-8.86%
jan 1, 2005
0.865
-0.011
-1.29%
jan 1, 2006
0.911
+0.046
5.32%
jan 1, 2007
0.76
-0.151
-16.52%
jan 1, 2008
0.516
-0.244
-32.15%
jan 1, 2009
0.527
+0.011
2.06%
jan 1, 2010
0.335
-0.191
-36.33%
jan 1, 2011
0.407
+0.072
21.5%
jan 1, 2012
0.357
-0.05
-12.24%
jan 1, 2013
0.393
+0.035
9.82%
jan 1, 2014
0.299
-0.094
-23.88%
jan 1, 2015
0.277
-0.022
-7.42%
Ranking of countries by current statistics by years


Comments: