29
/
en
AIzaSyAYiBZKx7MnpbEhh9jyipgxe19OcubqV5w
April 1, 2024
188071
Malaysia
MYS
true
2
1
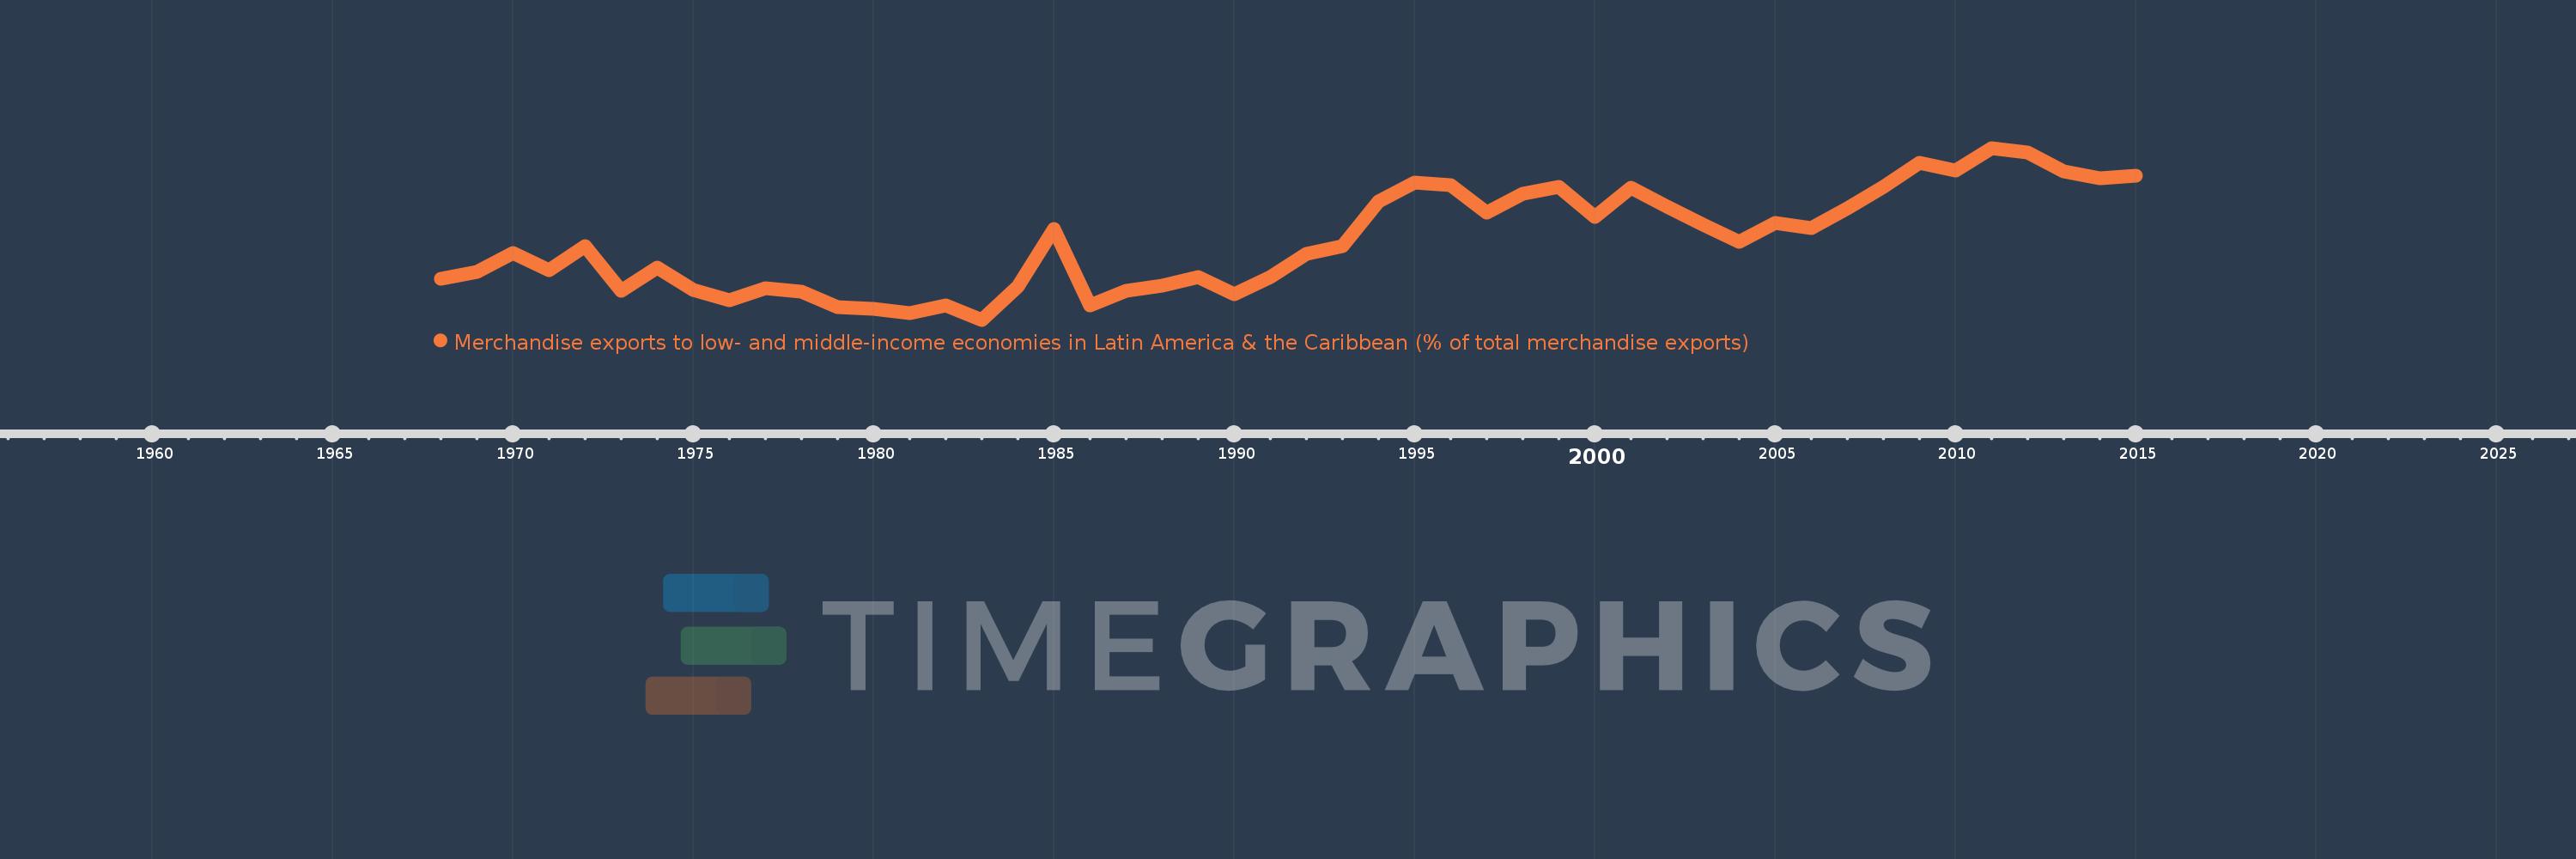
Merchandise exports to low- and middle-income economies in Latin America & the Caribbean (% of total merchandise exports)
2015,2014,2013,2012,2011,2010,2009,2008,2007,2006,2005,2004,2003,2002,2001,2000,1999,1998,1997,1996,1995,1994,1993,1992,1991,1990,1989,1988,1987,1986,1985,1984,1983,1982,1981,1980,1979,1978,1977,1976,1975,1974,1973,1972,1971,1970,1969,1968
This statistics in other country:
AfghanistanAlbaniaAlgeriaAngolaAntigua and BarbudaArab WorldArgentinaArmeniaArubaAustraliaAustriaAzerbaijanBahamas, TheBahrainBangladeshBarbadosBelarusBelgiumBelizeBeninBermudaBoliviaBrazilBrunei DarussalamBulgariaBurundiCabo VerdeCambodiaCameroonCanadaCaribbean small statesCentral African RepublicCentral Europe and the BalticsChileChinaColombiaCongo, Dem. Rep.Congo, Rep.Costa RicaCote d'IvoireCroatiaCubaCyprusCzech RepublicDenmarkDominicaDominican RepublicEarly-demographic dividendEast Asia & PacificEast Asia & Pacific (excluding high income)East Asia & Pacific (IDA & IBRD countries)EcuadorEgypt, Arab Rep.El SalvadorEstoniaEthiopiaEuro areaEurope & Central AsiaEurope & Central Asia (excluding high income)Europe & Central Asia (IDA & IBRD countries)European UnionFaroe IslandsFijiFinlandFragile and conflict affected situationsFranceFrench PolynesiaGabonGambia, TheGeorgiaGermanyGhanaGibraltarGreeceGreenlandGrenadaGuatemalaGuineaGuyanaHaitiHeavily indebted poor countries (HIPC)High incomeHondurasHong Kong SAR, ChinaHungaryIBRD onlyIcelandIDA & IBRD totalIDA blendIDA onlyIDA totalIndiaIndonesiaIran, Islamic Rep.IraqIrelandIsraelItalyJamaicaJapanJordanKazakhstanKenyaKorea, Dem. People’s Rep.Korea, Rep.KuwaitLao PDRLate-demographic dividendLatin America & Caribbean Latin America & Caribbean (excluding high income)Latin America & the Caribbean (IDA & IBRD countries)LatviaLeast developed countries: UN classificationLebanonLiberiaLibyaLithuaniaLow & middle incomeLow incomeLower middle incomeLuxembourgMacao SAR, ChinaMacedonia, FYRMadagascarMalawiMalaysiaMaliMaltaMauritaniaMauritiusMexicoMiddle East & North AfricaMiddle East & North Africa (excluding high income)Middle East & North Africa (IDA & IBRD countries)Middle incomeMongoliaMontenegroMoroccoMozambiqueMyanmarNetherlandsNew CaledoniaNew ZealandNicaraguaNigerNigeriaNorth AmericaNorwayOECD membersOmanOther small statesPacific island small statesPakistanPanamaPapua New GuineaParaguayPeruPhilippinesPolandPortugalPost-demographic dividendPre-demographic dividendQatarRomaniaRussian FederationRwandaSamoaSaudi ArabiaSenegalSerbiaSierra LeoneSingaporeSlovak RepublicSloveniaSmall statesSomaliaSouth AfricaSouth AsiaSouth Asia (IDA & IBRD)SpainSri LankaSt. Kitts and NevisSt. LuciaSt. Vincent and the GrenadinesSub-Saharan Africa Sub-Saharan Africa (excluding high income)Sub-Saharan Africa (IDA & IBRD countries)SudanSurinameSwedenSwitzerlandSyrian Arab RepublicTanzaniaThailandTogoTrinidad and TobagoTunisiaTurkeyUgandaUkraineUnited Arab EmiratesUnited KingdomUnited StatesUpper middle incomeUruguayVenezuela, RBVietnamWorldYemen, Rep.ZambiaZimbabwe Timeline:
This timeline shows a graph from 1968 to 2015 of Malaysia. No data until 1967. Number of actual observations by date: 48.
Source name:
World Development Indicators
Source organization:
World Bank staff estimates based data from International Monetary Fund's Direction of Trade database.
Categories, topics:
Private Sector, Trade
Last updated:
apr 23, 2017
Indicators value changes by year
At the date of observation
Value
Absolute change
Change from previous value
jan 1, 1968
0.553
+0.553
0.0%
jan 1, 1969
0.605
+0.051
9.3%
jan 1, 1970
0.761
+0.156
25.87%
jan 1, 1971
0.624
-0.138
-18.09%
jan 1, 1972
0.82
+0.196
31.46%
jan 1, 1973
0.454
-0.365
-44.57%
jan 1, 1974
0.644
+0.189
41.63%
jan 1, 1975
0.462
-0.181
-28.14%
jan 1, 1976
0.379
-0.083
-17.96%
jan 1, 1977
0.477
+0.098
25.82%
jan 1, 1978
0.444
-0.033
-6.97%
jan 1, 1979
0.318
-0.126
-28.47%
jan 1, 1980
0.304
-0.013
-4.23%
jan 1, 1981
0.268
-0.036
-11.92%
jan 1, 1982
0.337
+0.069
25.71%
jan 1, 1983
0.216
-0.121
-35.98%
jan 1, 1984
0.485
+0.269
124.71%
jan 1, 1985
0.959
+0.474
97.8%
jan 1, 1986
0.331
-0.628
-65.49%
jan 1, 1987
0.452
+0.121
36.71%
jan 1, 1988
0.496
+0.044
9.72%
jan 1, 1989
0.568
+0.071
14.39%
jan 1, 1990
0.425
-0.143
-25.14%
jan 1, 1991
0.565
+0.14
33.02%
jan 1, 1992
0.756
+0.191
33.85%
jan 1, 1993
0.819
+0.063
8.29%
jan 1, 1994
1.182
+0.363
44.33%
jan 1, 1995
1.342
+0.16
13.52%
jan 1, 1996
1.32
-0.022
-1.67%
jan 1, 1997
1.093
-0.227
-17.22%
jan 1, 1998
1.248
+0.156
14.24%
jan 1, 1999
1.301
+0.053
4.25%
jan 1, 2000
1.061
-0.24
-18.42%
jan 1, 2001
1.295
+0.234
22.03%
jan 1, 2002
1.141
-0.155
-11.94%
jan 1, 2003
0.998
-0.142
-12.49%
jan 1, 2004
0.853
-0.145
-14.52%
jan 1, 2005
1.01
+0.157
18.41%
jan 1, 2006
0.969
-0.041
-4.07%
jan 1, 2007
1.131
+0.162
16.72%
jan 1, 2008
1.304
+0.172
15.24%
jan 1, 2009
1.503
+0.2
15.34%
jan 1, 2010
1.437
-0.067
-4.44%
jan 1, 2011
1.623
+0.186
12.96%
jan 1, 2012
1.586
-0.037
-2.25%
jan 1, 2013
1.428
-0.159
-10.0%
jan 1, 2014
1.376
-0.051
-3.6%
jan 1, 2015
1.398
+0.022
1.6%
Ranking of countries by current statistics by years


Comments: