29
/
en
AIzaSyAYiBZKx7MnpbEhh9jyipgxe19OcubqV5w
April 1, 2024
52808
OECD members
OED
false
2
1
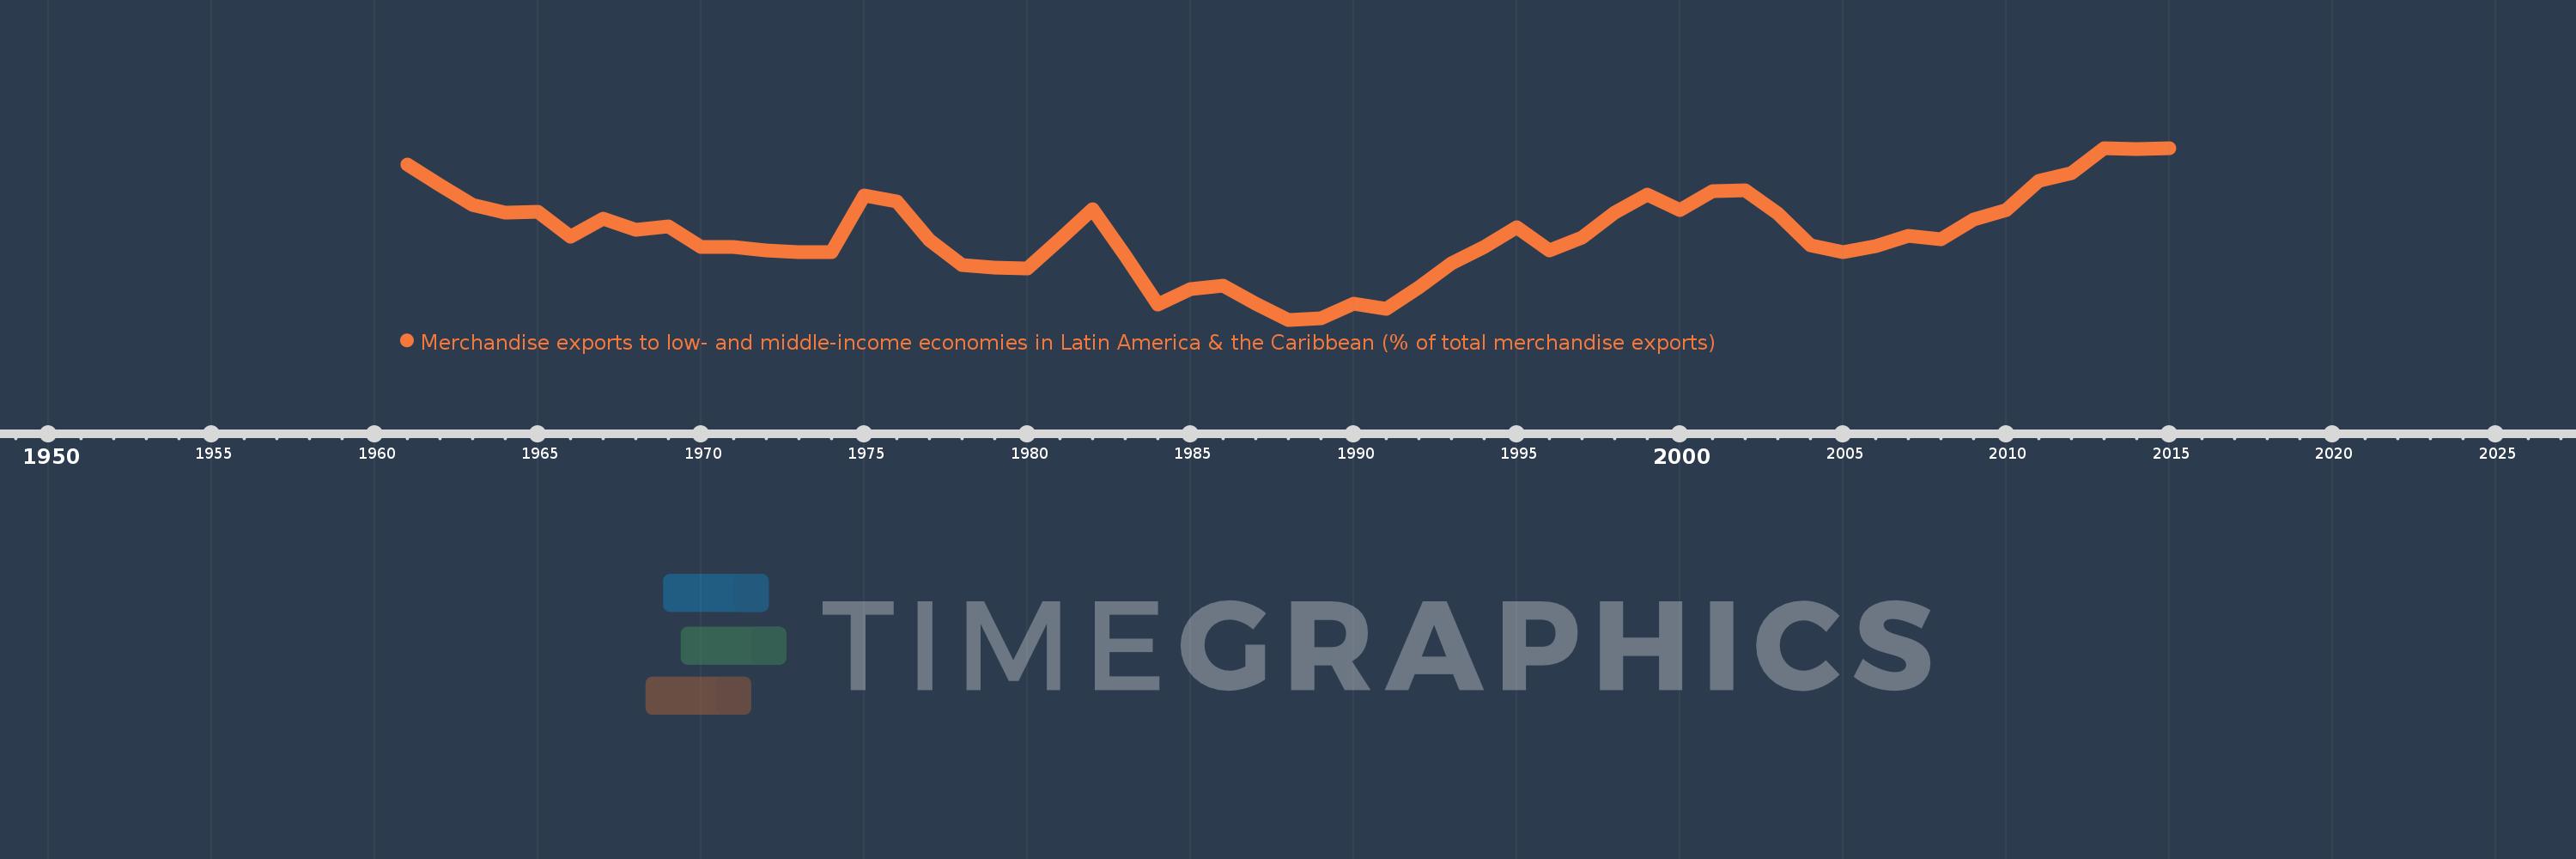
Merchandise exports to low- and middle-income economies in Latin America & the Caribbean (% of total merchandise exports)
2015,2014,2013,2012,2011,2010,2009,2008,2007,2006,2005,2004,2003,2002,2001,2000,1999,1998,1997,1996,1995,1994,1993,1992,1991,1990,1989,1988,1987,1986,1985,1984,1983,1982,1981,1980,1979,1978,1977,1976,1975,1974,1973,1972,1971,1970,1969,1968,1967,1966,1965,1964,1963,1962,1961
This statistics in other country:
AfghanistanAlbaniaAlgeriaAngolaAntigua and BarbudaArab WorldArgentinaArmeniaArubaAustraliaAustriaAzerbaijanBahamas, TheBahrainBangladeshBarbadosBelarusBelgiumBelizeBeninBermudaBoliviaBrazilBrunei DarussalamBulgariaBurundiCabo VerdeCambodiaCameroonCanadaCaribbean small statesCentral African RepublicCentral Europe and the BalticsChileChinaColombiaCongo, Dem. Rep.Congo, Rep.Costa RicaCote d'IvoireCroatiaCubaCyprusCzech RepublicDenmarkDominicaDominican RepublicEarly-demographic dividendEast Asia & PacificEast Asia & Pacific (excluding high income)East Asia & Pacific (IDA & IBRD countries)EcuadorEgypt, Arab Rep.El SalvadorEstoniaEthiopiaEuro areaEurope & Central AsiaEurope & Central Asia (excluding high income)Europe & Central Asia (IDA & IBRD countries)European UnionFaroe IslandsFijiFinlandFragile and conflict affected situationsFranceFrench PolynesiaGabonGambia, TheGeorgiaGermanyGhanaGibraltarGreeceGreenlandGrenadaGuatemalaGuineaGuyanaHaitiHeavily indebted poor countries (HIPC)High incomeHondurasHong Kong SAR, ChinaHungaryIBRD onlyIcelandIDA & IBRD totalIDA blendIDA onlyIDA totalIndiaIndonesiaIran, Islamic Rep.IraqIrelandIsraelItalyJamaicaJapanJordanKazakhstanKenyaKorea, Dem. People’s Rep.Korea, Rep.KuwaitLao PDRLate-demographic dividendLatin America & Caribbean Latin America & Caribbean (excluding high income)Latin America & the Caribbean (IDA & IBRD countries)LatviaLeast developed countries: UN classificationLebanonLiberiaLibyaLithuaniaLow & middle incomeLow incomeLower middle incomeLuxembourgMacao SAR, ChinaMacedonia, FYRMadagascarMalawiMalaysiaMaliMaltaMauritaniaMauritiusMexicoMiddle East & North AfricaMiddle East & North Africa (excluding high income)Middle East & North Africa (IDA & IBRD countries)Middle incomeMongoliaMontenegroMoroccoMozambiqueMyanmarNetherlandsNew CaledoniaNew ZealandNicaraguaNigerNigeriaNorth AmericaNorwayOECD membersOmanOther small statesPacific island small statesPakistanPanamaPapua New GuineaParaguayPeruPhilippinesPolandPortugalPost-demographic dividendPre-demographic dividendQatarRomaniaRussian FederationRwandaSamoaSaudi ArabiaSenegalSerbiaSierra LeoneSingaporeSlovak RepublicSloveniaSmall statesSomaliaSouth AfricaSouth AsiaSouth Asia (IDA & IBRD)SpainSri LankaSt. Kitts and NevisSt. LuciaSt. Vincent and the GrenadinesSub-Saharan Africa Sub-Saharan Africa (excluding high income)Sub-Saharan Africa (IDA & IBRD countries)SudanSurinameSwedenSwitzerlandSyrian Arab RepublicTanzaniaThailandTogoTrinidad and TobagoTunisiaTurkeyUgandaUkraineUnited Arab EmiratesUnited KingdomUnited StatesUpper middle incomeUruguayVenezuela, RBVietnamWorldYemen, Rep.ZambiaZimbabwe Timeline:
This timeline shows a graph from 1961 to 2015 of OECD members. No data until 1960. Number of actual observations by date: 55.
Source name:
World Development Indicators
Source organization:
World Bank staff estimates based data from International Monetary Fund's Direction of Trade database.
Categories, topics:
Private Sector, Trade
Last updated:
apr 23, 2017
Indicators value changes by year
At the date of observation
Value
Absolute change
Change from previous value
jan 1, 1961
5.337
+5.337
0.0%
jan 1, 1962
5.015
-0.322
-6.03%
jan 1, 1963
4.701
-0.314
-6.26%
jan 1, 1964
4.585
-0.116
-2.47%
jan 1, 1965
4.599
+0.014
0.3%
jan 1, 1966
4.196
-0.403
-8.76%
jan 1, 1967
4.486
+0.29
6.9%
jan 1, 1968
4.316
-0.17
-3.78%
jan 1, 1969
4.368
+0.052
1.2%
jan 1, 1970
4.034
-0.334
-7.65%
jan 1, 1971
4.041
+0.007
0.17%
jan 1, 1972
3.985
-0.056
-1.38%
jan 1, 1973
3.953
-0.032
-0.81%
jan 1, 1974
3.954
+0.001
0.04%
jan 1, 1975
4.847
+0.893
22.58%
jan 1, 1976
4.752
-0.095
-1.97%
jan 1, 1977
4.149
-0.603
-12.68%
jan 1, 1978
3.758
-0.391
-9.41%
jan 1, 1979
3.721
-0.037
-0.98%
jan 1, 1980
3.695
-0.026
-0.71%
jan 1, 1981
4.156
+0.461
12.47%
jan 1, 1982
4.63
+0.474
11.4%
jan 1, 1983
3.91
-0.72
-15.55%
jan 1, 1984
3.133
-0.777
-19.87%
jan 1, 1985
3.373
+0.239
7.64%
jan 1, 1986
3.426
+0.054
1.59%
jan 1, 1987
3.144
-0.282
-8.23%
jan 1, 1988
2.893
-0.251
-8.0%
jan 1, 1989
2.919
+0.026
0.9%
jan 1, 1990
3.141
+0.222
7.62%
jan 1, 1991
3.066
-0.075
-2.38%
jan 1, 1992
3.404
+0.338
11.02%
jan 1, 1993
3.785
+0.38
11.18%
jan 1, 1994
4.044
+0.259
6.85%
jan 1, 1995
4.355
+0.31
7.68%
jan 1, 1996
3.989
-0.366
-8.4%
jan 1, 1997
4.183
+0.194
4.87%
jan 1, 1998
4.58
+0.397
9.48%
jan 1, 1999
4.861
+0.281
6.14%
jan 1, 2000
4.627
-0.234
-4.81%
jan 1, 2001
4.92
+0.293
6.33%
jan 1, 2002
4.938
+0.018
0.38%
jan 1, 2003
4.567
-0.371
-7.51%
jan 1, 2004
4.067
-0.5
-10.95%
jan 1, 2005
3.953
-0.114
-2.81%
jan 1, 2006
4.053
+0.101
2.55%
jan 1, 2007
4.212
+0.159
3.92%
jan 1, 2008
4.165
-0.048
-1.13%
jan 1, 2009
4.469
+0.304
7.3%
jan 1, 2010
4.618
+0.149
3.34%
jan 1, 2011
5.087
+0.469
10.17%
jan 1, 2012
5.204
+0.117
2.29%
jan 1, 2013
5.592
+0.388
7.45%
jan 1, 2014
5.582
-0.01
-0.17%
jan 1, 2015
5.6
+0.018
0.31%
Ranking of countries by current statistics by years


Comments: