29
/
en
AIzaSyAYiBZKx7MnpbEhh9jyipgxe19OcubqV5w
April 1, 2024
139520
Germany
DEU
true
2
1
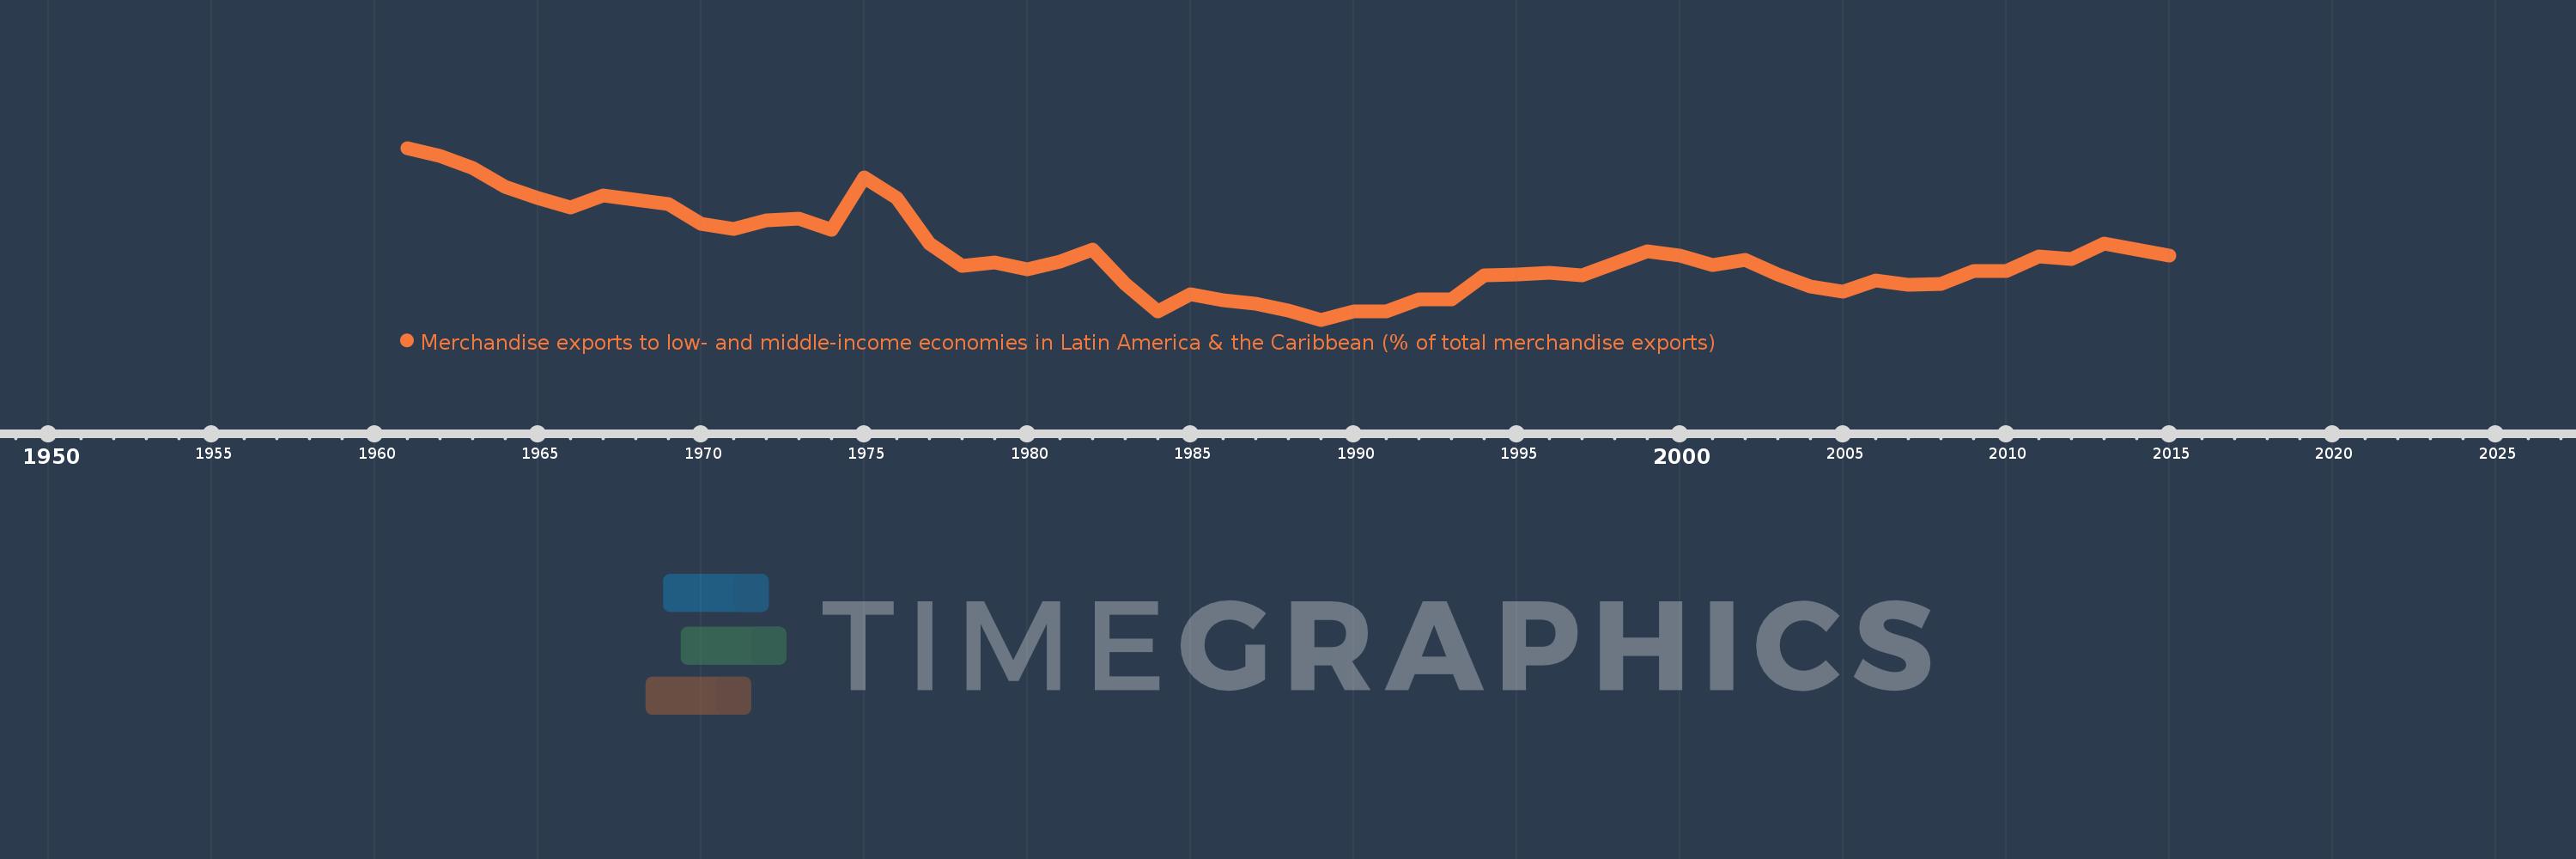
Merchandise exports to low- and middle-income economies in Latin America & the Caribbean (% of total merchandise exports)
2015,2014,2013,2012,2011,2010,2009,2008,2007,2006,2005,2004,2003,2002,2001,2000,1999,1998,1997,1996,1995,1994,1993,1992,1991,1990,1989,1988,1987,1986,1985,1984,1983,1982,1981,1980,1979,1978,1977,1976,1975,1974,1973,1972,1971,1970,1969,1968,1967,1966,1965,1964,1963,1962,1961
This statistics in other country:
AfghanistanAlbaniaAlgeriaAngolaAntigua and BarbudaArab WorldArgentinaArmeniaArubaAustraliaAustriaAzerbaijanBahamas, TheBahrainBangladeshBarbadosBelarusBelgiumBelizeBeninBermudaBoliviaBrazilBrunei DarussalamBulgariaBurundiCabo VerdeCambodiaCameroonCanadaCaribbean small statesCentral African RepublicCentral Europe and the BalticsChileChinaColombiaCongo, Dem. Rep.Congo, Rep.Costa RicaCote d'IvoireCroatiaCubaCyprusCzech RepublicDenmarkDominicaDominican RepublicEarly-demographic dividendEast Asia & PacificEast Asia & Pacific (excluding high income)East Asia & Pacific (IDA & IBRD countries)EcuadorEgypt, Arab Rep.El SalvadorEstoniaEthiopiaEuro areaEurope & Central AsiaEurope & Central Asia (excluding high income)Europe & Central Asia (IDA & IBRD countries)European UnionFaroe IslandsFijiFinlandFragile and conflict affected situationsFranceFrench PolynesiaGabonGambia, TheGeorgiaGermanyGhanaGibraltarGreeceGreenlandGrenadaGuatemalaGuineaGuyanaHaitiHeavily indebted poor countries (HIPC)High incomeHondurasHong Kong SAR, ChinaHungaryIBRD onlyIcelandIDA & IBRD totalIDA blendIDA onlyIDA totalIndiaIndonesiaIran, Islamic Rep.IraqIrelandIsraelItalyJamaicaJapanJordanKazakhstanKenyaKorea, Dem. People’s Rep.Korea, Rep.KuwaitLao PDRLate-demographic dividendLatin America & Caribbean Latin America & Caribbean (excluding high income)Latin America & the Caribbean (IDA & IBRD countries)LatviaLeast developed countries: UN classificationLebanonLiberiaLibyaLithuaniaLow & middle incomeLow incomeLower middle incomeLuxembourgMacao SAR, ChinaMacedonia, FYRMadagascarMalawiMalaysiaMaliMaltaMauritaniaMauritiusMexicoMiddle East & North AfricaMiddle East & North Africa (excluding high income)Middle East & North Africa (IDA & IBRD countries)Middle incomeMongoliaMontenegroMoroccoMozambiqueMyanmarNetherlandsNew CaledoniaNew ZealandNicaraguaNigerNigeriaNorth AmericaNorwayOECD membersOmanOther small statesPacific island small statesPakistanPanamaPapua New GuineaParaguayPeruPhilippinesPolandPortugalPost-demographic dividendPre-demographic dividendQatarRomaniaRussian FederationRwandaSamoaSaudi ArabiaSenegalSerbiaSierra LeoneSingaporeSlovak RepublicSloveniaSmall statesSomaliaSouth AfricaSouth AsiaSouth Asia (IDA & IBRD)SpainSri LankaSt. Kitts and NevisSt. LuciaSt. Vincent and the GrenadinesSub-Saharan Africa Sub-Saharan Africa (excluding high income)Sub-Saharan Africa (IDA & IBRD countries)SudanSurinameSwedenSwitzerlandSyrian Arab RepublicTanzaniaThailandTogoTrinidad and TobagoTunisiaTurkeyUgandaUkraineUnited Arab EmiratesUnited KingdomUnited StatesUpper middle incomeUruguayVenezuela, RBVietnamWorldYemen, Rep.ZambiaZimbabwe Timeline:
This timeline shows a graph from 1961 to 2015 of Germany. No data until 1960. Number of actual observations by date: 55.
Source name:
World Development Indicators
Source organization:
World Bank staff estimates based data from International Monetary Fund's Direction of Trade database.
Categories, topics:
Private Sector, Trade
Last updated:
apr 23, 2017
Indicators value changes by year
At the date of observation
Value
Absolute change
Change from previous value
jan 1, 1961
3.813
+3.813
0.0%
jan 1, 1962
3.684
-0.13
-3.4%
jan 1, 1963
3.498
-0.185
-5.04%
jan 1, 1964
3.208
-0.29
-8.29%
jan 1, 1965
3.035
-0.173
-5.39%
jan 1, 1966
2.878
-0.157
-5.17%
jan 1, 1967
3.067
+0.189
6.57%
jan 1, 1968
3.007
-0.061
-1.98%
jan 1, 1969
2.942
-0.065
-2.16%
jan 1, 1970
2.628
-0.314
-10.67%
jan 1, 1971
2.55
-0.077
-2.94%
jan 1, 1972
2.687
+0.137
5.35%
jan 1, 1973
2.713
+0.026
0.98%
jan 1, 1974
2.528
-0.185
-6.83%
jan 1, 1975
3.347
+0.819
32.4%
jan 1, 1976
3.026
-0.322
-9.61%
jan 1, 1977
2.325
-0.7
-23.14%
jan 1, 1978
1.969
-0.357
-15.35%
jan 1, 1979
2.02
+0.052
2.63%
jan 1, 1980
1.924
-0.097
-4.79%
jan 1, 1981
2.043
+0.12
6.22%
jan 1, 1982
2.221
+0.178
8.73%
jan 1, 1983
1.695
-0.527
-23.7%
jan 1, 1984
1.254
-0.441
-26.04%
jan 1, 1985
1.532
+0.278
22.21%
jan 1, 1986
1.439
-0.093
-6.07%
jan 1, 1987
1.377
-0.062
-4.31%
jan 1, 1988
1.279
-0.098
-7.12%
jan 1, 1989
1.13
-0.149
-11.69%
jan 1, 1990
1.257
+0.128
11.3%
jan 1, 1991
1.259
+0.001
0.12%
jan 1, 1992
1.449
+0.191
15.16%
jan 1, 1993
1.454
+0.004
0.29%
jan 1, 1994
1.826
+0.372
25.59%
jan 1, 1995
1.84
+0.014
0.76%
jan 1, 1996
1.86
+0.021
1.13%
jan 1, 1997
1.817
-0.043
-2.33%
jan 1, 1998
2.013
+0.196
10.78%
jan 1, 1999
2.196
+0.183
9.12%
jan 1, 2000
2.13
-0.066
-3.02%
jan 1, 2001
1.978
-0.152
-7.12%
jan 1, 2002
2.065
+0.086
4.37%
jan 1, 2003
1.84
-0.224
-10.87%
jan 1, 2004
1.646
-0.195
-10.58%
jan 1, 2005
1.565
-0.081
-4.89%
jan 1, 2006
1.743
+0.177
11.34%
jan 1, 2007
1.681
-0.061
-3.51%
jan 1, 2008
1.695
+0.014
0.82%
jan 1, 2009
1.888
+0.193
11.38%
jan 1, 2010
1.886
-0.002
-0.1%
jan 1, 2011
2.123
+0.236
12.53%
jan 1, 2012
2.084
-0.039
-1.82%
jan 1, 2013
2.319
+0.235
11.27%
jan 1, 2014
2.229
-0.09
-3.88%
jan 1, 2015
2.133
-0.096
-4.29%
Ranking of countries by current statistics by years


Comments: