29
/
en
AIzaSyAYiBZKx7MnpbEhh9jyipgxe19OcubqV5w
April 1, 2024
256589
Sweden
SWE
true
2
1
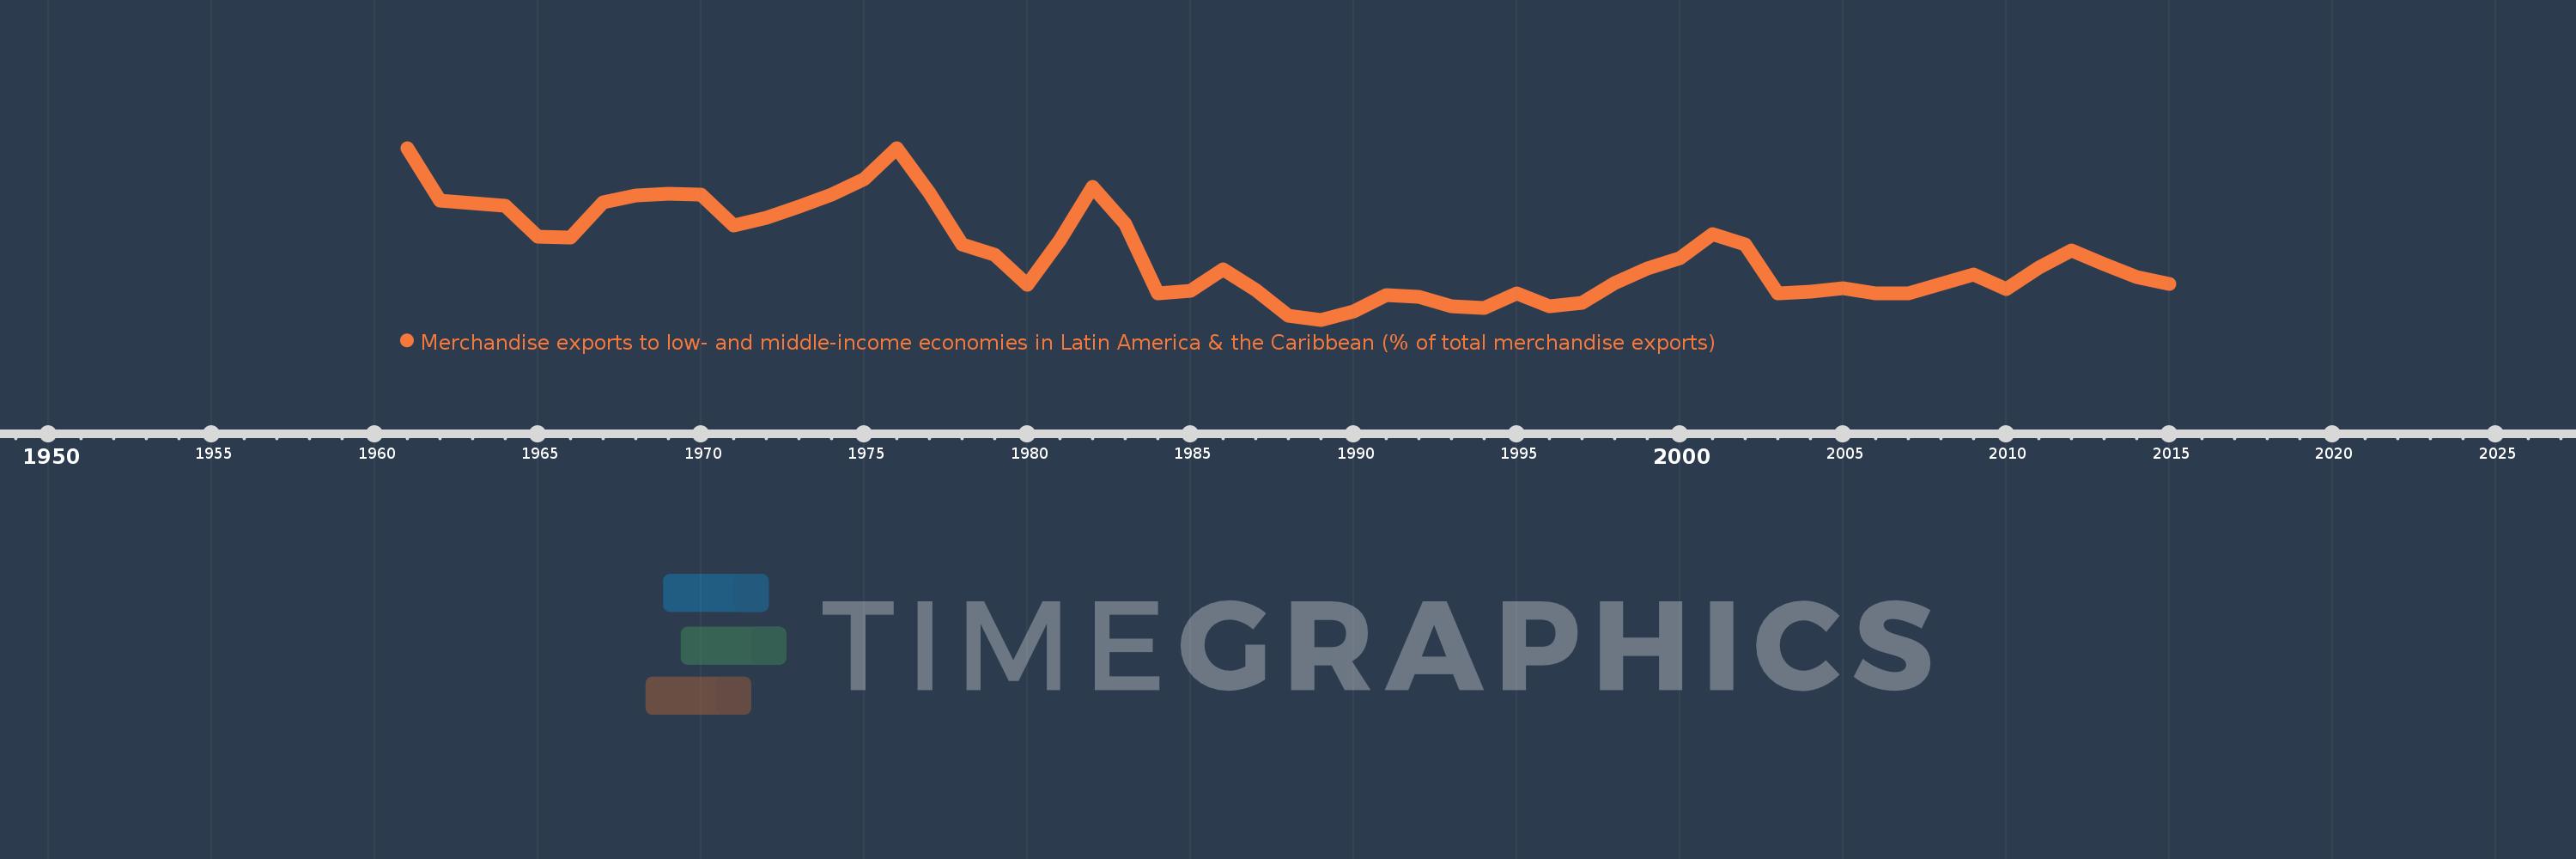
Merchandise exports to low- and middle-income economies in Latin America & the Caribbean (% of total merchandise exports)
2015,2014,2013,2012,2011,2010,2009,2008,2007,2006,2005,2004,2003,2002,2001,2000,1999,1998,1997,1996,1995,1994,1993,1992,1991,1990,1989,1988,1987,1986,1985,1984,1983,1982,1981,1980,1979,1978,1977,1976,1975,1974,1973,1972,1971,1970,1969,1968,1967,1966,1965,1964,1963,1962,1961
Global statistics library →Sweden →Merchandise exports to low- and middle-income economies in Latin America & the Caribbean (% of total merchandise exports)
This statistics in other country:
AfghanistanAlbaniaAlgeriaAngolaAntigua and BarbudaArab WorldArgentinaArmeniaArubaAustraliaAustriaAzerbaijanBahamas, TheBahrainBangladeshBarbadosBelarusBelgiumBelizeBeninBermudaBoliviaBrazilBrunei DarussalamBulgariaBurundiCabo VerdeCambodiaCameroonCanadaCaribbean small statesCentral African RepublicCentral Europe and the BalticsChileChinaColombiaCongo, Dem. Rep.Congo, Rep.Costa RicaCote d'IvoireCroatiaCubaCyprusCzech RepublicDenmarkDominicaDominican RepublicEarly-demographic dividendEast Asia & PacificEast Asia & Pacific (excluding high income)East Asia & Pacific (IDA & IBRD countries)EcuadorEgypt, Arab Rep.El SalvadorEstoniaEthiopiaEuro areaEurope & Central AsiaEurope & Central Asia (excluding high income)Europe & Central Asia (IDA & IBRD countries)European UnionFaroe IslandsFijiFinlandFragile and conflict affected situationsFranceFrench PolynesiaGabonGambia, TheGeorgiaGermanyGhanaGibraltarGreeceGreenlandGrenadaGuatemalaGuineaGuyanaHaitiHeavily indebted poor countries (HIPC)High incomeHondurasHong Kong SAR, ChinaHungaryIBRD onlyIcelandIDA & IBRD totalIDA blendIDA onlyIDA totalIndiaIndonesiaIran, Islamic Rep.IraqIrelandIsraelItalyJamaicaJapanJordanKazakhstanKenyaKorea, Dem. People’s Rep.Korea, Rep.KuwaitLao PDRLate-demographic dividendLatin America & Caribbean Latin America & Caribbean (excluding high income)Latin America & the Caribbean (IDA & IBRD countries)LatviaLeast developed countries: UN classificationLebanonLiberiaLibyaLithuaniaLow & middle incomeLow incomeLower middle incomeLuxembourgMacao SAR, ChinaMacedonia, FYRMadagascarMalawiMalaysiaMaliMaltaMauritaniaMauritiusMexicoMiddle East & North AfricaMiddle East & North Africa (excluding high income)Middle East & North Africa (IDA & IBRD countries)Middle incomeMongoliaMontenegroMoroccoMozambiqueMyanmarNetherlandsNew CaledoniaNew ZealandNicaraguaNigerNigeriaNorth AmericaNorwayOECD membersOmanOther small statesPacific island small statesPakistanPanamaPapua New GuineaParaguayPeruPhilippinesPolandPortugalPost-demographic dividendPre-demographic dividendQatarRomaniaRussian FederationRwandaSamoaSaudi ArabiaSenegalSerbiaSierra LeoneSingaporeSlovak RepublicSloveniaSmall statesSomaliaSouth AfricaSouth AsiaSouth Asia (IDA & IBRD)SpainSri LankaSt. Kitts and NevisSt. LuciaSt. Vincent and the GrenadinesSub-Saharan Africa Sub-Saharan Africa (excluding high income)Sub-Saharan Africa (IDA & IBRD countries)SudanSurinameSwedenSwitzerlandSyrian Arab RepublicTanzaniaThailandTogoTrinidad and TobagoTunisiaTurkeyUgandaUkraineUnited Arab EmiratesUnited KingdomUnited StatesUpper middle incomeUruguayVenezuela, RBVietnamWorldYemen, Rep.ZambiaZimbabwe Timeline:
This timeline shows a graph from 1961 to 2015 of Sweden. No data until 1960. Number of actual observations by date: 55.
Source name:
World Development Indicators
Source organization:
World Bank staff estimates based data from International Monetary Fund's Direction of Trade database.
Categories, topics:
Private Sector, Trade
Last updated:
apr 23, 2017
Indicators value changes by year
At the date of observation
Value
Absolute change
Change from previous value
jan 1, 1962
2.847
-0.753
-20.92%
jan 1, 1963
2.81
-0.037
-1.3%
jan 1, 1964
2.777
-0.033
-1.16%
jan 1, 1965
2.342
-0.435
-15.67%
jan 1, 1966
2.325
-0.017
-0.72%
jan 1, 1967
2.833
+0.508
21.83%
jan 1, 1968
2.926
+0.094
3.32%
jan 1, 1969
2.954
+0.028
0.94%
jan 1, 1970
2.934
-0.02
-0.69%
jan 1, 1971
2.492
-0.442
-15.05%
jan 1, 1972
2.61
+0.118
4.73%
jan 1, 1973
2.761
+0.151
5.78%
jan 1, 1974
2.942
+0.181
6.55%
jan 1, 1975
3.154
+0.212
7.21%
jan 1, 1976
3.605
+0.451
14.3%
jan 1, 1977
2.961
-0.643
-17.85%
jan 1, 1978
2.23
-0.731
-24.69%
jan 1, 1979
2.076
-0.154
-6.91%
jan 1, 1980
1.656
-0.42
-20.24%
jan 1, 1981
2.29
+0.634
38.27%
jan 1, 1982
3.053
+0.764
33.35%
jan 1, 1983
2.521
-0.532
-17.43%
jan 1, 1984
1.531
-0.99
-39.26%
jan 1, 1985
1.565
+0.034
2.19%
jan 1, 1986
1.869
+0.304
19.45%
jan 1, 1987
1.572
-0.298
-15.92%
jan 1, 1988
1.211
-0.36
-22.92%
jan 1, 1989
1.151
-0.061
-5.0%
jan 1, 1990
1.268
+0.117
10.2%
jan 1, 1991
1.499
+0.231
18.2%
jan 1, 1992
1.483
-0.016
-1.09%
jan 1, 1993
1.339
-0.144
-9.7%
jan 1, 1994
1.32
-0.019
-1.39%
jan 1, 1995
1.525
+0.205
15.51%
jan 1, 1996
1.339
-0.186
-12.23%
jan 1, 1997
1.392
+0.053
3.99%
jan 1, 1998
1.68
+0.288
20.71%
jan 1, 1999
1.885
+0.205
12.18%
jan 1, 2000
2.027
+0.142
7.55%
jan 1, 2001
2.378
+0.351
17.3%
jan 1, 2002
2.224
-0.154
-6.47%
jan 1, 2003
1.53
-0.694
-31.2%
jan 1, 2004
1.547
+0.016
1.06%
jan 1, 2005
1.607
+0.06
3.89%
jan 1, 2006
1.523
-0.084
-5.22%
jan 1, 2007
1.531
+0.008
0.53%
jan 1, 2008
1.666
+0.135
8.8%
jan 1, 2009
1.801
+0.135
8.1%
jan 1, 2010
1.594
-0.206
-11.44%
jan 1, 2011
1.895
+0.301
18.85%
jan 1, 2012
2.144
+0.249
13.11%
jan 1, 2013
1.951
-0.193
-8.98%
jan 1, 2014
1.762
-0.189
-9.69%
jan 1, 2015
1.659
-0.103
-5.84%
Ranking of countries by current statistics by years


Comments: