29
/
en
AIzaSyAYiBZKx7MnpbEhh9jyipgxe19OcubqV5w
April 1, 2024
36761
IBRD only
IBD
false
2
1
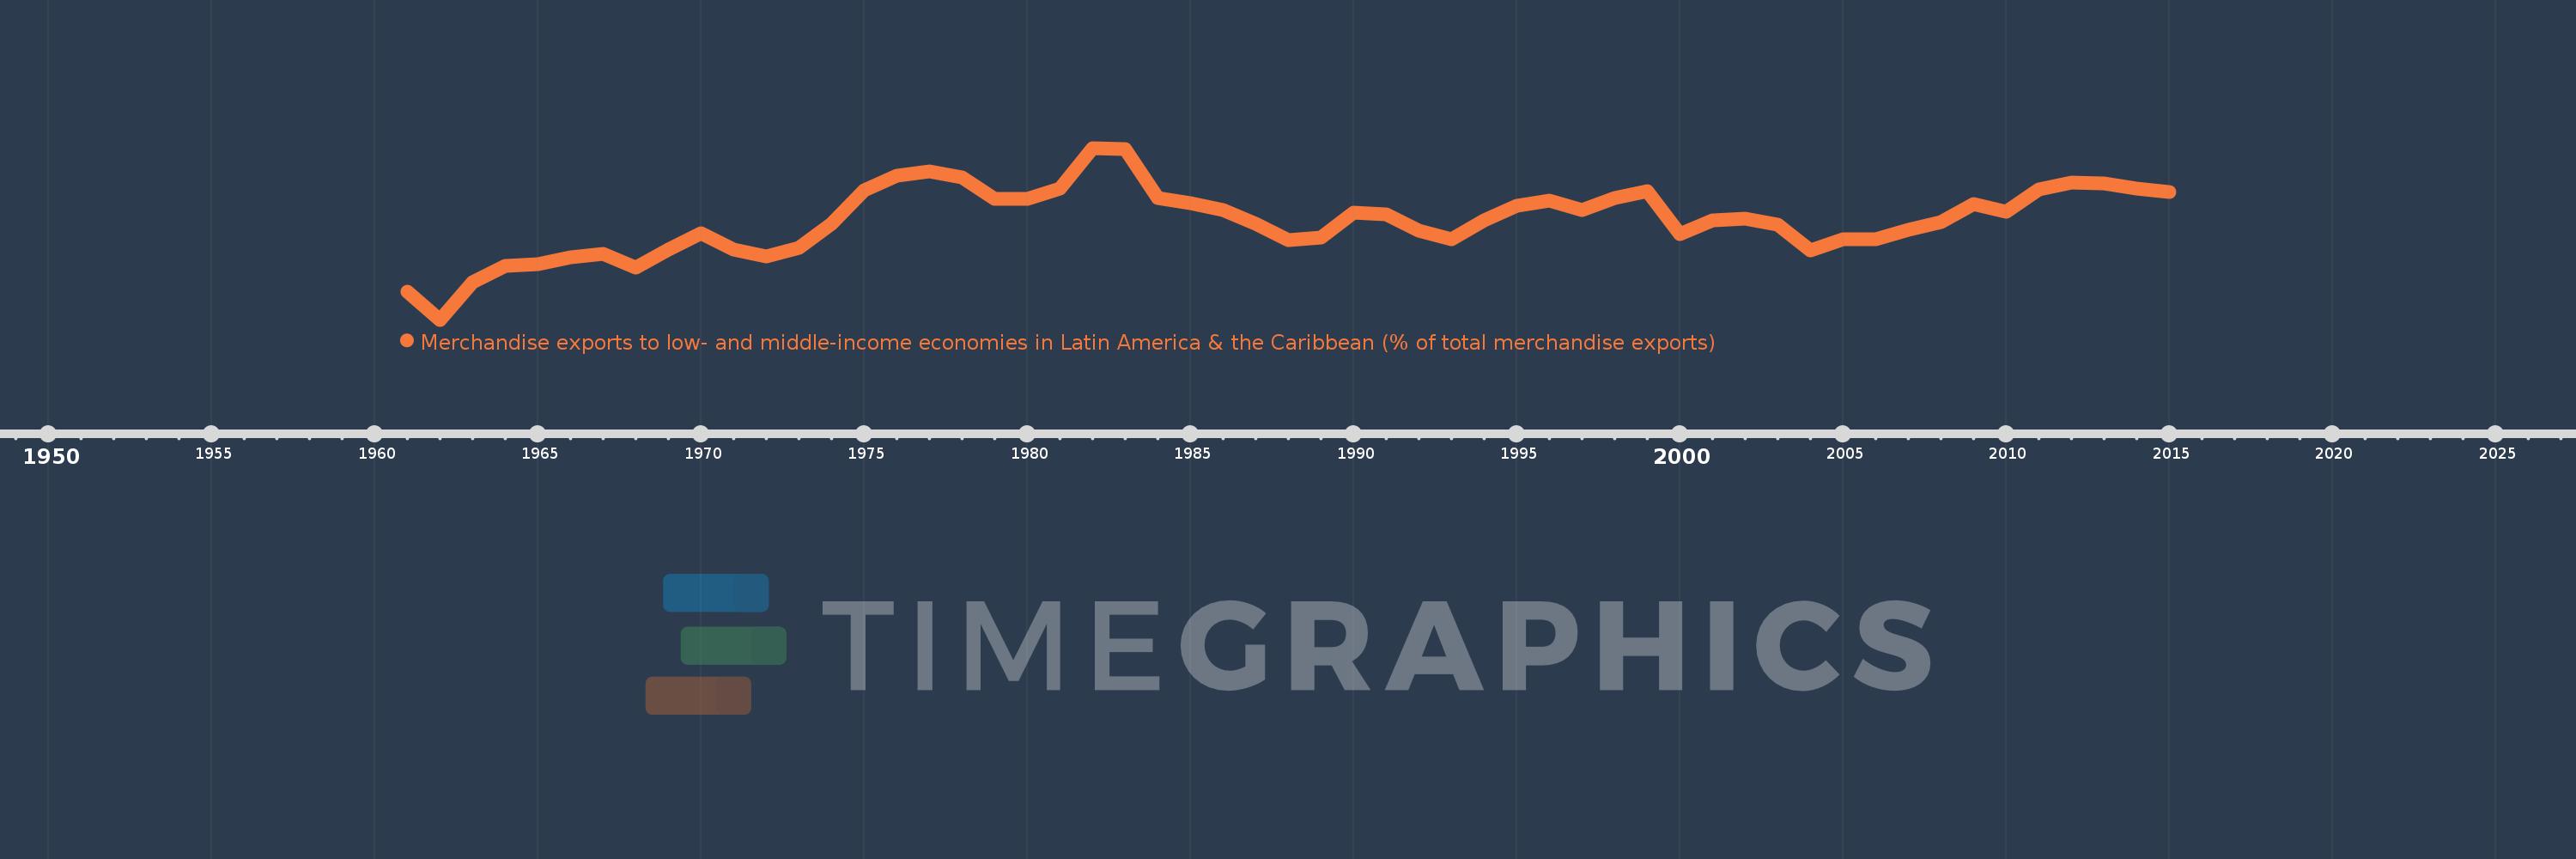
Merchandise exports to low- and middle-income economies in Latin America & the Caribbean (% of total merchandise exports)
2015,2014,2013,2012,2011,2010,2009,2008,2007,2006,2005,2004,2003,2002,2001,2000,1999,1998,1997,1996,1995,1994,1993,1992,1991,1990,1989,1988,1987,1986,1985,1984,1983,1982,1981,1980,1979,1978,1977,1976,1975,1974,1973,1972,1971,1970,1969,1968,1967,1966,1965,1964,1963,1962,1961
This statistics in other country:
AfghanistanAlbaniaAlgeriaAngolaAntigua and BarbudaArab WorldArgentinaArmeniaArubaAustraliaAustriaAzerbaijanBahamas, TheBahrainBangladeshBarbadosBelarusBelgiumBelizeBeninBermudaBoliviaBrazilBrunei DarussalamBulgariaBurundiCabo VerdeCambodiaCameroonCanadaCaribbean small statesCentral African RepublicCentral Europe and the BalticsChileChinaColombiaCongo, Dem. Rep.Congo, Rep.Costa RicaCote d'IvoireCroatiaCubaCyprusCzech RepublicDenmarkDominicaDominican RepublicEarly-demographic dividendEast Asia & PacificEast Asia & Pacific (excluding high income)East Asia & Pacific (IDA & IBRD countries)EcuadorEgypt, Arab Rep.El SalvadorEstoniaEthiopiaEuro areaEurope & Central AsiaEurope & Central Asia (excluding high income)Europe & Central Asia (IDA & IBRD countries)European UnionFaroe IslandsFijiFinlandFragile and conflict affected situationsFranceFrench PolynesiaGabonGambia, TheGeorgiaGermanyGhanaGibraltarGreeceGreenlandGrenadaGuatemalaGuineaGuyanaHaitiHeavily indebted poor countries (HIPC)High incomeHondurasHong Kong SAR, ChinaHungaryIBRD onlyIcelandIDA & IBRD totalIDA blendIDA onlyIDA totalIndiaIndonesiaIran, Islamic Rep.IraqIrelandIsraelItalyJamaicaJapanJordanKazakhstanKenyaKorea, Dem. People’s Rep.Korea, Rep.KuwaitLao PDRLate-demographic dividendLatin America & Caribbean Latin America & Caribbean (excluding high income)Latin America & the Caribbean (IDA & IBRD countries)LatviaLeast developed countries: UN classificationLebanonLiberiaLibyaLithuaniaLow & middle incomeLow incomeLower middle incomeLuxembourgMacao SAR, ChinaMacedonia, FYRMadagascarMalawiMalaysiaMaliMaltaMauritaniaMauritiusMexicoMiddle East & North AfricaMiddle East & North Africa (excluding high income)Middle East & North Africa (IDA & IBRD countries)Middle incomeMongoliaMontenegroMoroccoMozambiqueMyanmarNetherlandsNew CaledoniaNew ZealandNicaraguaNigerNigeriaNorth AmericaNorwayOECD membersOmanOther small statesPacific island small statesPakistanPanamaPapua New GuineaParaguayPeruPhilippinesPolandPortugalPost-demographic dividendPre-demographic dividendQatarRomaniaRussian FederationRwandaSamoaSaudi ArabiaSenegalSerbiaSierra LeoneSingaporeSlovak RepublicSloveniaSmall statesSomaliaSouth AfricaSouth AsiaSouth Asia (IDA & IBRD)SpainSri LankaSt. Kitts and NevisSt. LuciaSt. Vincent and the GrenadinesSub-Saharan Africa Sub-Saharan Africa (excluding high income)Sub-Saharan Africa (IDA & IBRD countries)SudanSurinameSwedenSwitzerlandSyrian Arab RepublicTanzaniaThailandTogoTrinidad and TobagoTunisiaTurkeyUgandaUkraineUnited Arab EmiratesUnited KingdomUnited StatesUpper middle incomeUruguayVenezuela, RBVietnamWorldYemen, Rep.ZambiaZimbabwe Timeline:
This timeline shows a graph from 1961 to 2015 of IBRD only. No data until 1960. Number of actual observations by date: 55.
Source name:
World Development Indicators
Source organization:
World Bank staff estimates based data from International Monetary Fund's Direction of Trade database.
Categories, topics:
Private Sector, Trade
Last updated:
apr 23, 2017
Indicators value changes by year
At the date of observation
Value
Absolute change
Change from previous value
jan 1, 1961
2.571
+2.571
0.0%
jan 1, 1962
2.051
-0.52
-20.22%
jan 1, 1963
2.748
+0.697
33.97%
jan 1, 1964
3.045
+0.297
10.82%
jan 1, 1965
3.074
+0.029
0.94%
jan 1, 1966
3.207
+0.133
4.32%
jan 1, 1967
3.273
+0.067
2.07%
jan 1, 1968
3.022
-0.251
-7.68%
jan 1, 1969
3.352
+0.33
10.93%
jan 1, 1970
3.658
+0.306
9.12%
jan 1, 1971
3.351
-0.307
-8.39%
jan 1, 1972
3.226
-0.125
-3.73%
jan 1, 1973
3.375
+0.149
4.61%
jan 1, 1974
3.827
+0.452
13.41%
jan 1, 1975
4.447
+0.62
16.21%
jan 1, 1976
4.717
+0.269
6.06%
jan 1, 1977
4.798
+0.081
1.72%
jan 1, 1978
4.686
-0.112
-2.34%
jan 1, 1979
4.28
-0.406
-8.66%
jan 1, 1980
4.292
+0.012
0.29%
jan 1, 1981
4.476
+0.184
4.29%
jan 1, 1982
5.228
+0.752
16.79%
jan 1, 1983
5.201
-0.027
-0.52%
jan 1, 1984
4.307
-0.894
-17.18%
jan 1, 1985
4.211
-0.096
-2.24%
jan 1, 1986
4.082
-0.129
-3.06%
jan 1, 1987
3.832
-0.25
-6.12%
jan 1, 1988
3.524
-0.307
-8.02%
jan 1, 1989
3.572
+0.048
1.36%
jan 1, 1990
4.031
+0.459
12.85%
jan 1, 1991
3.998
-0.033
-0.83%
jan 1, 1992
3.697
-0.301
-7.53%
jan 1, 1993
3.539
-0.158
-4.27%
jan 1, 1994
3.894
+0.355
10.03%
jan 1, 1995
4.162
+0.267
6.87%
jan 1, 1996
4.249
+0.087
2.09%
jan 1, 1997
4.087
-0.162
-3.81%
jan 1, 1998
4.3
+0.213
5.2%
jan 1, 1999
4.425
+0.125
2.92%
jan 1, 2000
3.631
-0.794
-17.94%
jan 1, 2001
3.887
+0.256
7.05%
jan 1, 2002
3.922
+0.035
0.9%
jan 1, 2003
3.813
-0.11
-2.8%
jan 1, 2004
3.331
-0.482
-12.64%
jan 1, 2005
3.535
+0.204
6.13%
jan 1, 2006
3.539
+0.004
0.11%
jan 1, 2007
3.707
+0.168
4.74%
jan 1, 2008
3.861
+0.154
4.17%
jan 1, 2009
4.19
+0.329
8.53%
jan 1, 2010
4.046
-0.145
-3.45%
jan 1, 2011
4.468
+0.422
10.43%
jan 1, 2012
4.589
+0.121
2.7%
jan 1, 2013
4.574
-0.015
-0.32%
jan 1, 2014
4.483
-0.091
-2.0%
jan 1, 2015
4.412
-0.071
-1.58%
Ranking of countries by current statistics by years


Comments: