29
/
en
AIzaSyAYiBZKx7MnpbEhh9jyipgxe19OcubqV5w
April 1, 2024
40093
IDA total
IDA
false
2
1
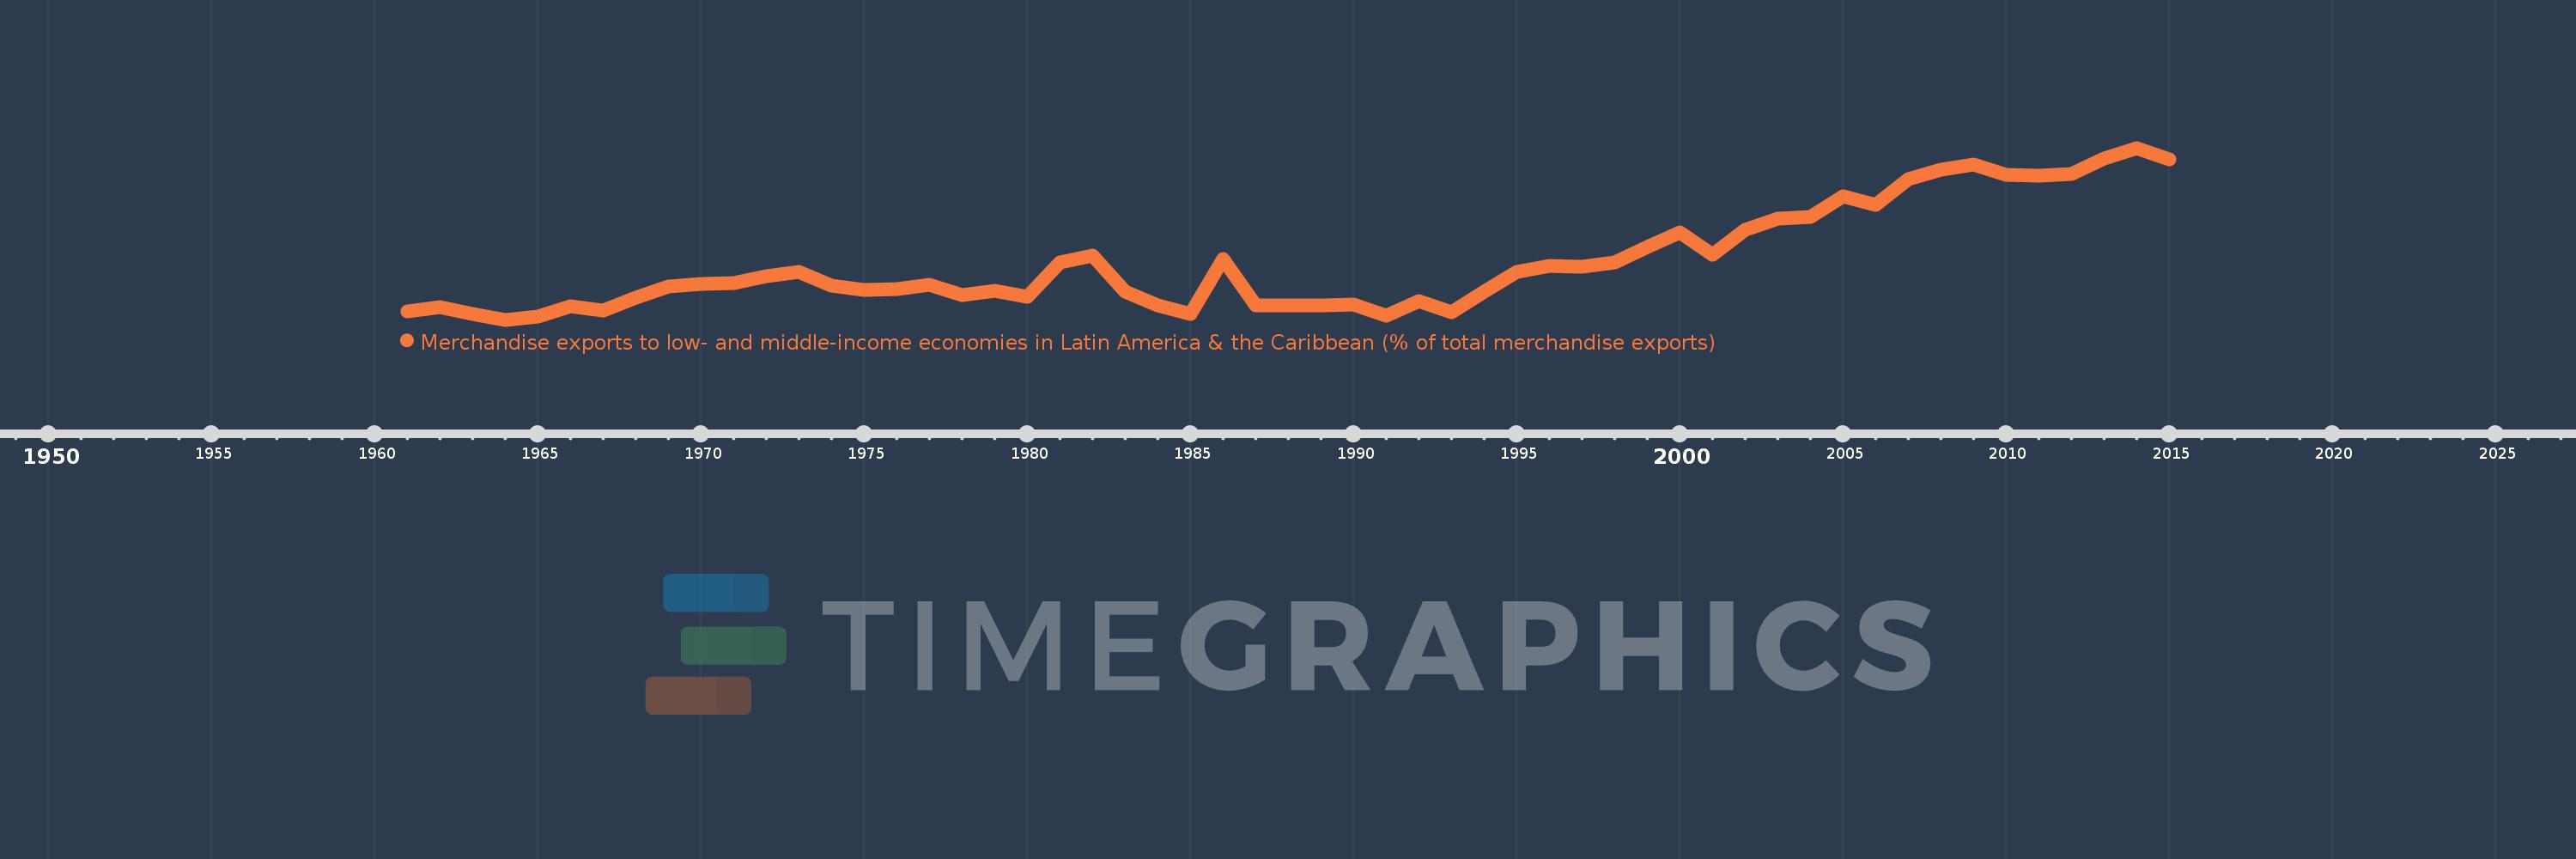
Merchandise exports to low- and middle-income economies in Latin America & the Caribbean (% of total merchandise exports)
2015,2014,2013,2012,2011,2010,2009,2008,2007,2006,2005,2004,2003,2002,2001,2000,1999,1998,1997,1996,1995,1994,1993,1992,1991,1990,1989,1988,1987,1986,1985,1984,1983,1982,1981,1980,1979,1978,1977,1976,1975,1974,1973,1972,1971,1970,1969,1968,1967,1966,1965,1964,1963,1962,1961
This statistics in other country:
AfghanistanAlbaniaAlgeriaAngolaAntigua and BarbudaArab WorldArgentinaArmeniaArubaAustraliaAustriaAzerbaijanBahamas, TheBahrainBangladeshBarbadosBelarusBelgiumBelizeBeninBermudaBoliviaBrazilBrunei DarussalamBulgariaBurundiCabo VerdeCambodiaCameroonCanadaCaribbean small statesCentral African RepublicCentral Europe and the BalticsChileChinaColombiaCongo, Dem. Rep.Congo, Rep.Costa RicaCote d'IvoireCroatiaCubaCyprusCzech RepublicDenmarkDominicaDominican RepublicEarly-demographic dividendEast Asia & PacificEast Asia & Pacific (excluding high income)East Asia & Pacific (IDA & IBRD countries)EcuadorEgypt, Arab Rep.El SalvadorEstoniaEthiopiaEuro areaEurope & Central AsiaEurope & Central Asia (excluding high income)Europe & Central Asia (IDA & IBRD countries)European UnionFaroe IslandsFijiFinlandFragile and conflict affected situationsFranceFrench PolynesiaGabonGambia, TheGeorgiaGermanyGhanaGibraltarGreeceGreenlandGrenadaGuatemalaGuineaGuyanaHaitiHeavily indebted poor countries (HIPC)High incomeHondurasHong Kong SAR, ChinaHungaryIBRD onlyIcelandIDA & IBRD totalIDA blendIDA onlyIDA totalIndiaIndonesiaIran, Islamic Rep.IraqIrelandIsraelItalyJamaicaJapanJordanKazakhstanKenyaKorea, Dem. People’s Rep.Korea, Rep.KuwaitLao PDRLate-demographic dividendLatin America & Caribbean Latin America & Caribbean (excluding high income)Latin America & the Caribbean (IDA & IBRD countries)LatviaLeast developed countries: UN classificationLebanonLiberiaLibyaLithuaniaLow & middle incomeLow incomeLower middle incomeLuxembourgMacao SAR, ChinaMacedonia, FYRMadagascarMalawiMalaysiaMaliMaltaMauritaniaMauritiusMexicoMiddle East & North AfricaMiddle East & North Africa (excluding high income)Middle East & North Africa (IDA & IBRD countries)Middle incomeMongoliaMontenegroMoroccoMozambiqueMyanmarNetherlandsNew CaledoniaNew ZealandNicaraguaNigerNigeriaNorth AmericaNorwayOECD membersOmanOther small statesPacific island small statesPakistanPanamaPapua New GuineaParaguayPeruPhilippinesPolandPortugalPost-demographic dividendPre-demographic dividendQatarRomaniaRussian FederationRwandaSamoaSaudi ArabiaSenegalSerbiaSierra LeoneSingaporeSlovak RepublicSloveniaSmall statesSomaliaSouth AfricaSouth AsiaSouth Asia (IDA & IBRD)SpainSri LankaSt. Kitts and NevisSt. LuciaSt. Vincent and the GrenadinesSub-Saharan Africa Sub-Saharan Africa (excluding high income)Sub-Saharan Africa (IDA & IBRD countries)SudanSurinameSwedenSwitzerlandSyrian Arab RepublicTanzaniaThailandTogoTrinidad and TobagoTunisiaTurkeyUgandaUkraineUnited Arab EmiratesUnited KingdomUnited StatesUpper middle incomeUruguayVenezuela, RBVietnamWorldYemen, Rep.ZambiaZimbabwe Timeline:
This timeline shows a graph from 1961 to 2015 of IDA total. No data until 1960. Number of actual observations by date: 55.
Source name:
World Development Indicators
Source organization:
World Bank staff estimates based data from International Monetary Fund's Direction of Trade database.
Categories, topics:
Private Sector, Trade
Last updated:
apr 23, 2017
Indicators value changes by year
At the date of observation
Value
Absolute change
Change from previous value
jan 1, 1961
0.815
+0.815
0.0%
jan 1, 1962
0.912
+0.097
11.86%
jan 1, 1963
0.749
-0.162
-17.78%
jan 1, 1964
0.618
-0.132
-17.55%
jan 1, 1965
0.692
+0.075
12.06%
jan 1, 1966
0.931
+0.238
34.41%
jan 1, 1967
0.842
-0.089
-9.53%
jan 1, 1968
1.134
+0.292
34.68%
jan 1, 1969
1.392
+0.258
22.72%
jan 1, 1970
1.469
+0.077
5.57%
jan 1, 1971
1.478
+0.009
0.63%
jan 1, 1972
1.64
+0.161
10.91%
jan 1, 1973
1.744
+0.104
6.35%
jan 1, 1974
1.425
-0.319
-18.28%
jan 1, 1975
1.319
-0.106
-7.45%
jan 1, 1976
1.339
+0.021
1.56%
jan 1, 1977
1.447
+0.108
8.07%
jan 1, 1978
1.2
-0.247
-17.06%
jan 1, 1979
1.292
+0.091
7.61%
jan 1, 1980
1.167
-0.125
-9.7%
jan 1, 1981
1.958
+0.791
67.85%
jan 1, 1982
2.125
+0.167
8.55%
jan 1, 1983
1.276
-0.85
-39.98%
jan 1, 1984
0.957
-0.318
-24.96%
jan 1, 1985
0.744
-0.213
-22.29%
jan 1, 1986
2.045
+1.301
174.9%
jan 1, 1987
0.95
-1.095
-53.56%
jan 1, 1988
0.958
+0.008
0.85%
jan 1, 1989
0.955
-0.003
-0.34%
jan 1, 1990
0.967
+0.013
1.35%
jan 1, 1991
0.721
-0.247
-25.51%
jan 1, 1992
1.061
+0.34
47.19%
jan 1, 1993
0.803
-0.258
-24.34%
jan 1, 1994
1.276
+0.473
58.99%
jan 1, 1995
1.754
+0.478
37.46%
jan 1, 1996
1.881
+0.127
7.25%
jan 1, 1997
1.861
-0.02
-1.06%
jan 1, 1998
1.976
+0.115
6.19%
jan 1, 1999
2.321
+0.345
17.46%
jan 1, 2000
2.681
+0.359
15.48%
jan 1, 2001
2.147
-0.534
-19.92%
jan 1, 2002
2.733
+0.586
27.29%
jan 1, 2003
2.993
+0.261
9.54%
jan 1, 2004
3.045
+0.051
1.72%
jan 1, 2005
3.524
+0.48
15.75%
jan 1, 2006
3.323
-0.202
-5.72%
jan 1, 2007
3.929
+0.606
18.25%
jan 1, 2008
4.143
+0.214
5.44%
jan 1, 2009
4.272
+0.129
3.11%
jan 1, 2010
4.022
-0.25
-5.85%
jan 1, 2011
4.004
-0.018
-0.45%
jan 1, 2012
4.046
+0.042
1.05%
jan 1, 2013
4.419
+0.373
9.22%
jan 1, 2014
4.663
+0.244
5.52%
jan 1, 2015
4.402
-0.26
-5.59%
Ranking of countries by current statistics by years


Comments: