29
/
en
AIzaSyAYiBZKx7MnpbEhh9jyipgxe19OcubqV5w
April 1, 2024
135785
Gabon
GAB
true
2
1
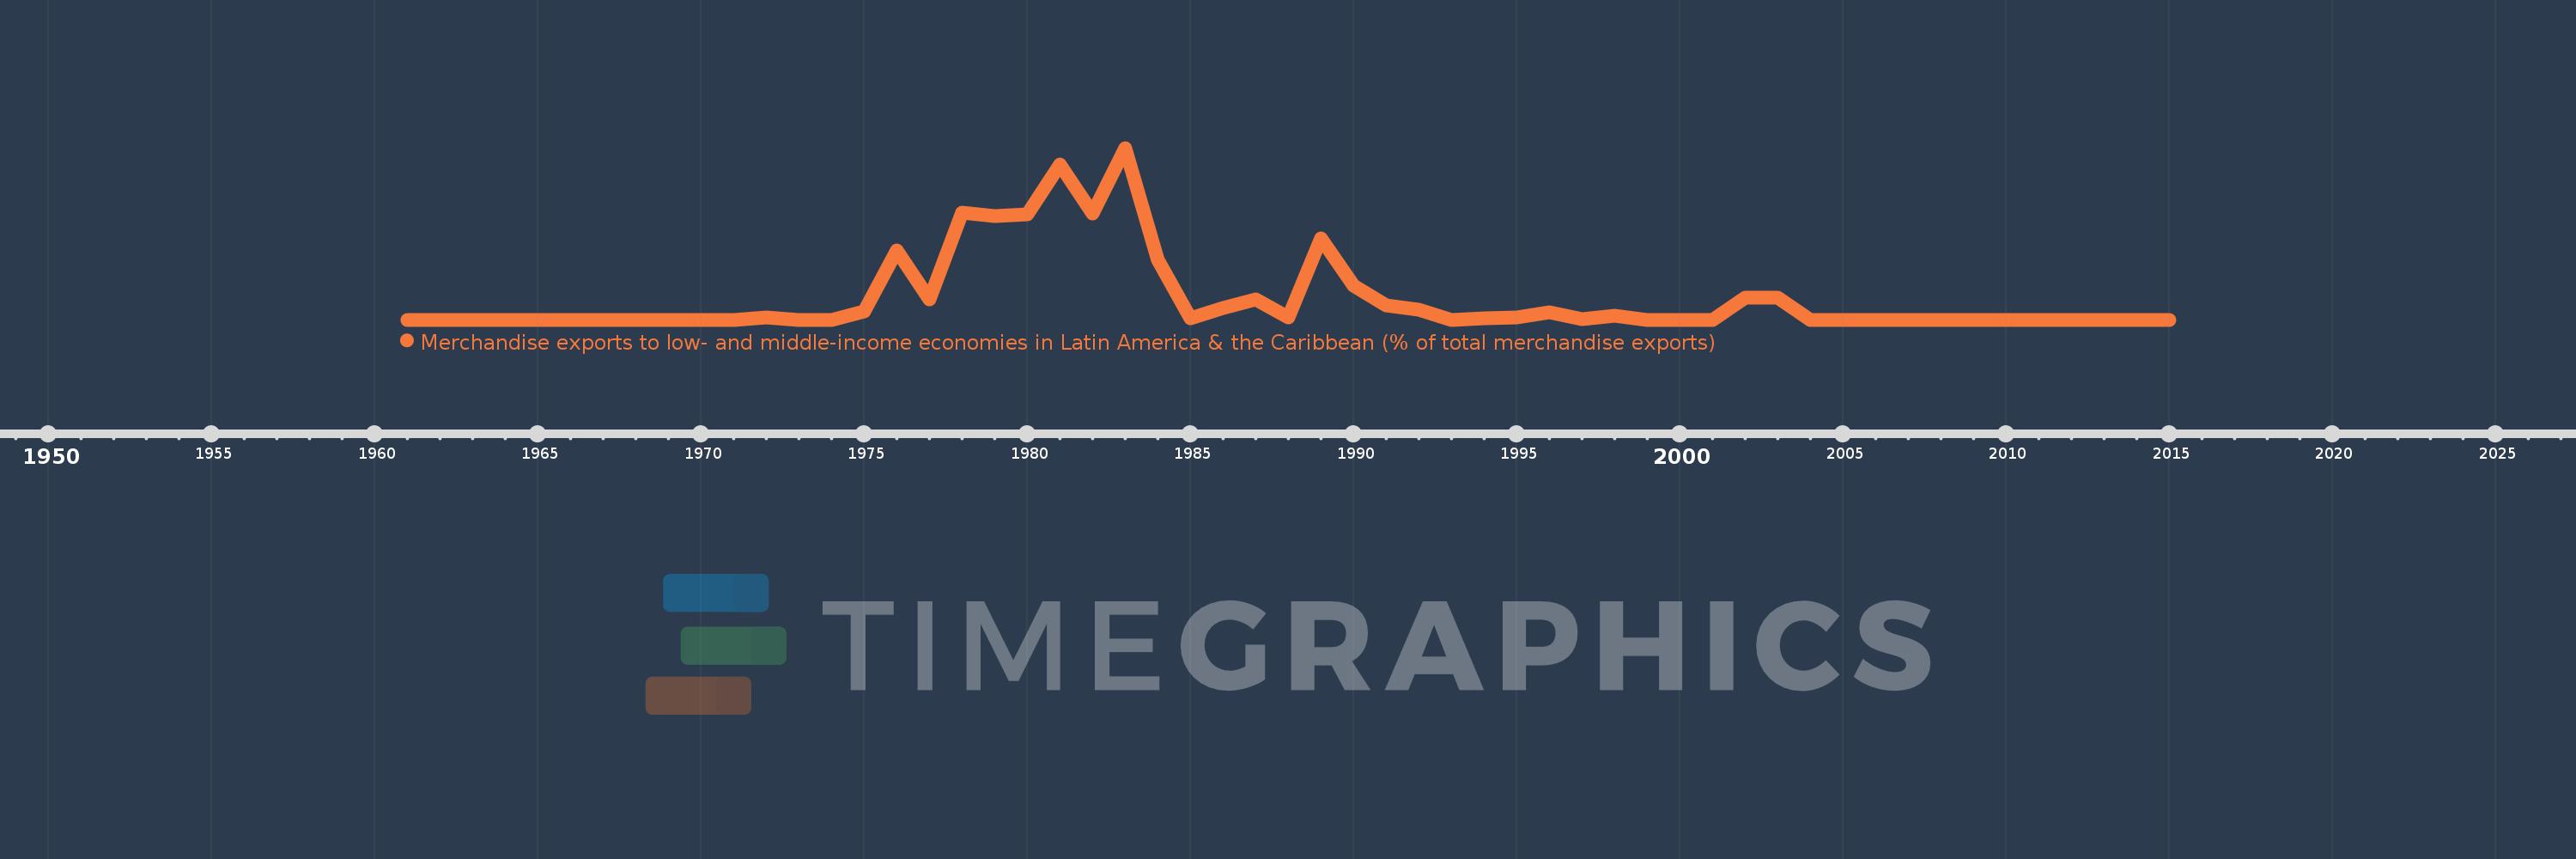
Merchandise exports to low- and middle-income economies in Latin America & the Caribbean (% of total merchandise exports)
2015,2014,2013,2012,2011,2010,2009,2008,2007,2006,2005,2004,2003,2002,2001,2000,1999,1998,1997,1996,1995,1994,1993,1992,1991,1990,1989,1988,1987,1986,1985,1984,1983,1982,1981,1980,1979,1978,1977,1976,1975,1974,1973,1972,1971,1970,1969,1968,1967,1966,1965,1964,1963,1962,1961
Global statistics library →Gabon →Merchandise exports to low- and middle-income economies in Latin America & the Caribbean (% of total merchandise exports)
This statistics in other country:
AfghanistanAlbaniaAlgeriaAngolaAntigua and BarbudaArab WorldArgentinaArmeniaArubaAustraliaAustriaAzerbaijanBahamas, TheBahrainBangladeshBarbadosBelarusBelgiumBelizeBeninBermudaBoliviaBrazilBrunei DarussalamBulgariaBurundiCabo VerdeCambodiaCameroonCanadaCaribbean small statesCentral African RepublicCentral Europe and the BalticsChileChinaColombiaCongo, Dem. Rep.Congo, Rep.Costa RicaCote d'IvoireCroatiaCubaCyprusCzech RepublicDenmarkDominicaDominican RepublicEarly-demographic dividendEast Asia & PacificEast Asia & Pacific (excluding high income)East Asia & Pacific (IDA & IBRD countries)EcuadorEgypt, Arab Rep.El SalvadorEstoniaEthiopiaEuro areaEurope & Central AsiaEurope & Central Asia (excluding high income)Europe & Central Asia (IDA & IBRD countries)European UnionFaroe IslandsFijiFinlandFragile and conflict affected situationsFranceFrench PolynesiaGabonGambia, TheGeorgiaGermanyGhanaGibraltarGreeceGreenlandGrenadaGuatemalaGuineaGuyanaHaitiHeavily indebted poor countries (HIPC)High incomeHondurasHong Kong SAR, ChinaHungaryIBRD onlyIcelandIDA & IBRD totalIDA blendIDA onlyIDA totalIndiaIndonesiaIran, Islamic Rep.IraqIrelandIsraelItalyJamaicaJapanJordanKazakhstanKenyaKorea, Dem. People’s Rep.Korea, Rep.KuwaitLao PDRLate-demographic dividendLatin America & Caribbean Latin America & Caribbean (excluding high income)Latin America & the Caribbean (IDA & IBRD countries)LatviaLeast developed countries: UN classificationLebanonLiberiaLibyaLithuaniaLow & middle incomeLow incomeLower middle incomeLuxembourgMacao SAR, ChinaMacedonia, FYRMadagascarMalawiMalaysiaMaliMaltaMauritaniaMauritiusMexicoMiddle East & North AfricaMiddle East & North Africa (excluding high income)Middle East & North Africa (IDA & IBRD countries)Middle incomeMongoliaMontenegroMoroccoMozambiqueMyanmarNetherlandsNew CaledoniaNew ZealandNicaraguaNigerNigeriaNorth AmericaNorwayOECD membersOmanOther small statesPacific island small statesPakistanPanamaPapua New GuineaParaguayPeruPhilippinesPolandPortugalPost-demographic dividendPre-demographic dividendQatarRomaniaRussian FederationRwandaSamoaSaudi ArabiaSenegalSerbiaSierra LeoneSingaporeSlovak RepublicSloveniaSmall statesSomaliaSouth AfricaSouth AsiaSouth Asia (IDA & IBRD)SpainSri LankaSt. Kitts and NevisSt. LuciaSt. Vincent and the GrenadinesSub-Saharan Africa Sub-Saharan Africa (excluding high income)Sub-Saharan Africa (IDA & IBRD countries)SudanSurinameSwedenSwitzerlandSyrian Arab RepublicTanzaniaThailandTogoTrinidad and TobagoTunisiaTurkeyUgandaUkraineUnited Arab EmiratesUnited KingdomUnited StatesUpper middle incomeUruguayVenezuela, RBVietnamWorldYemen, Rep.ZambiaZimbabwe Timeline:
This timeline shows a graph from 1961 to 2015 of Gabon. No data until 1960. Number of actual observations by date: 55.
Source name:
World Development Indicators
Source organization:
World Bank staff estimates based data from International Monetary Fund's Direction of Trade database.
Categories, topics:
Private Sector, Trade
Last updated:
apr 23, 2017
Indicators value changes by year
At the date of observation
Value
Absolute change
Change from previous value
jan 1, 1972
0.166
+0.166
%
jan 1, 1973
0.0
-0.166
-100.0%
jan 1, 1975
0.671
+0.671
%
jan 1, 1976
5.664
+4.993
744.12%
jan 1, 1977
1.638
-4.026
-71.09%
jan 1, 1978
8.704
+7.067
431.49%
jan 1, 1979
8.41
-0.294
-3.38%
jan 1, 1980
8.57
+0.16
1.9%
jan 1, 1981
12.617
+4.047
47.22%
jan 1, 1982
8.68
-3.936
-31.2%
jan 1, 1983
13.98
+5.3
61.05%
jan 1, 1984
4.842
-9.138
-65.36%
jan 1, 1985
0.144
-4.698
-97.02%
jan 1, 1986
0.957
+0.813
563.02%
jan 1, 1987
1.66
+0.703
73.42%
jan 1, 1988
0.208
-1.452
-87.48%
jan 1, 1989
6.598
+6.391
3.08K%
jan 1, 1990
2.772
-3.826
-57.99%
jan 1, 1991
1.177
-1.595
-57.54%
jan 1, 1992
0.785
-0.391
-33.27%
jan 1, 1993
0.0
-0.785
-99.97%
jan 1, 1994
0.148
+0.147
54.84K%
jan 1, 1995
0.16
+0.013
8.57%
jan 1, 1996
0.576
+0.415
259.06%
jan 1, 1997
0.048
-0.527
-91.63%
jan 1, 1998
0.311
+0.263
544.93%
jan 1, 1999
0.009
-0.301
-97.0%
jan 1, 2000
0.005
-0.004
-44.69%
jan 1, 2001
0.008
+0.003
59.08%
jan 1, 2002
1.784
+1.775
21.65K%
jan 1, 2003
1.777
-0.007
-0.38%
jan 1, 2004
0.006
-1.771
-99.68%
jan 1, 2005
0.003
-0.003
-55.35%
jan 1, 2006
0.003
+0.001
26.77%
jan 1, 2007
0.007
+0.004
122.56%
jan 1, 2008
0.004
-0.003
-42.1%
jan 1, 2009
0.006
+0.002
54.74%
jan 1, 2010
0.006
0.0
-1.61%
jan 1, 2011
0.012
+0.006
94.79%
jan 1, 2012
0.004
-0.009
-70.99%
jan 1, 2013
0.009
+0.005
152.04%
jan 1, 2014
0.008
-0.001
-8.8%
jan 1, 2015
0.009
+0.001
8.2%
Ranking of countries by current statistics by years


Comments: