29
/
en
AIzaSyAYiBZKx7MnpbEhh9jyipgxe19OcubqV5w
April 1, 2024
83054
Belize
BLZ
true
2
1
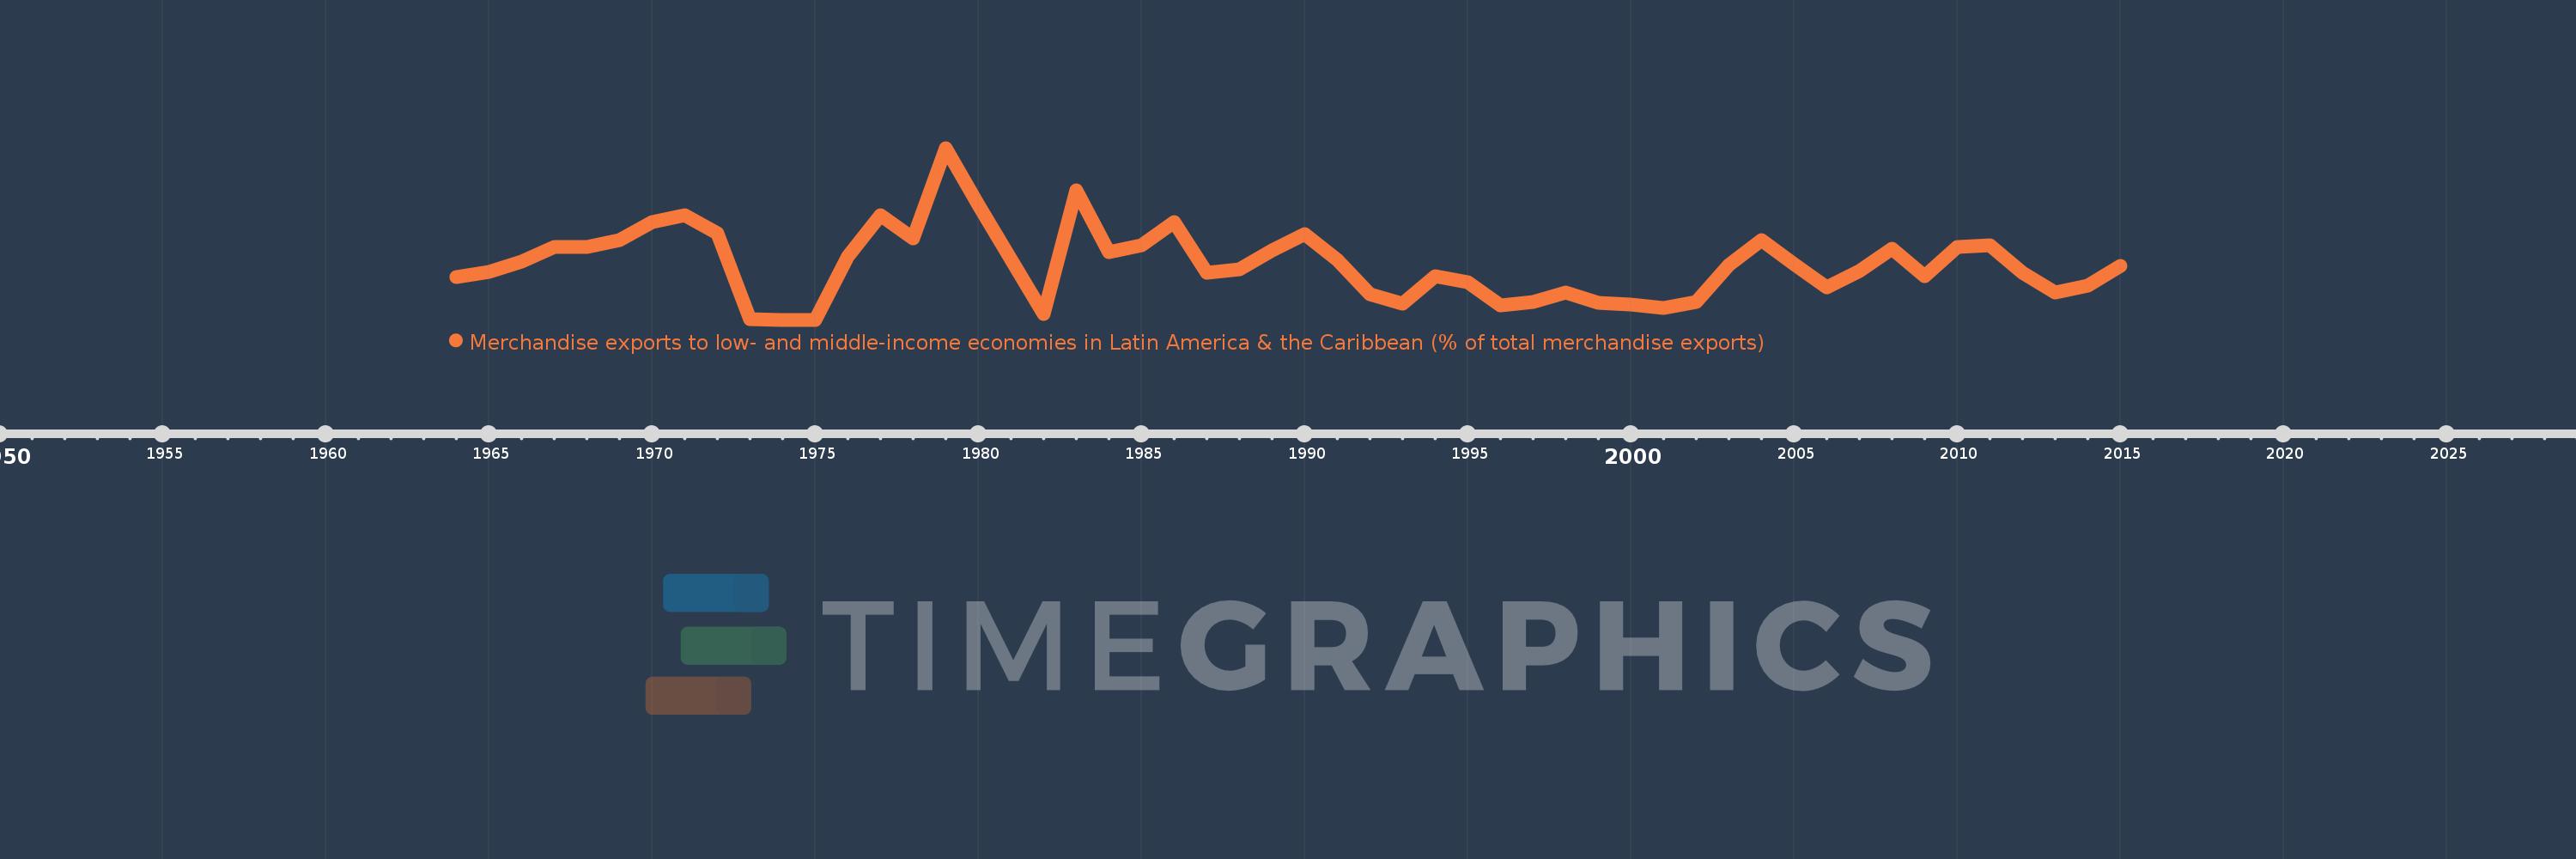
Merchandise exports to low- and middle-income economies in Latin America & the Caribbean (% of total merchandise exports)
2015,2014,2013,2012,2011,2010,2009,2008,2007,2006,2005,2004,2003,2002,2001,2000,1999,1998,1997,1996,1995,1994,1993,1992,1991,1990,1989,1988,1987,1986,1985,1984,1983,1982,1980,1979,1978,1977,1976,1975,1974,1973,1972,1971,1970,1969,1968,1967,1966,1965,1964
Global statistics library →Belize →Merchandise exports to low- and middle-income economies in Latin America & the Caribbean (% of total merchandise exports)
This statistics in other country:
AfghanistanAlbaniaAlgeriaAngolaAntigua and BarbudaArab WorldArgentinaArmeniaArubaAustraliaAustriaAzerbaijanBahamas, TheBahrainBangladeshBarbadosBelarusBelgiumBelizeBeninBermudaBoliviaBrazilBrunei DarussalamBulgariaBurundiCabo VerdeCambodiaCameroonCanadaCaribbean small statesCentral African RepublicCentral Europe and the BalticsChileChinaColombiaCongo, Dem. Rep.Congo, Rep.Costa RicaCote d'IvoireCroatiaCubaCyprusCzech RepublicDenmarkDominicaDominican RepublicEarly-demographic dividendEast Asia & PacificEast Asia & Pacific (excluding high income)East Asia & Pacific (IDA & IBRD countries)EcuadorEgypt, Arab Rep.El SalvadorEstoniaEthiopiaEuro areaEurope & Central AsiaEurope & Central Asia (excluding high income)Europe & Central Asia (IDA & IBRD countries)European UnionFaroe IslandsFijiFinlandFragile and conflict affected situationsFranceFrench PolynesiaGabonGambia, TheGeorgiaGermanyGhanaGibraltarGreeceGreenlandGrenadaGuatemalaGuineaGuyanaHaitiHeavily indebted poor countries (HIPC)High incomeHondurasHong Kong SAR, ChinaHungaryIBRD onlyIcelandIDA & IBRD totalIDA blendIDA onlyIDA totalIndiaIndonesiaIran, Islamic Rep.IraqIrelandIsraelItalyJamaicaJapanJordanKazakhstanKenyaKorea, Dem. People’s Rep.Korea, Rep.KuwaitLao PDRLate-demographic dividendLatin America & Caribbean Latin America & Caribbean (excluding high income)Latin America & the Caribbean (IDA & IBRD countries)LatviaLeast developed countries: UN classificationLebanonLiberiaLibyaLithuaniaLow & middle incomeLow incomeLower middle incomeLuxembourgMacao SAR, ChinaMacedonia, FYRMadagascarMalawiMalaysiaMaliMaltaMauritaniaMauritiusMexicoMiddle East & North AfricaMiddle East & North Africa (excluding high income)Middle East & North Africa (IDA & IBRD countries)Middle incomeMongoliaMontenegroMoroccoMozambiqueMyanmarNetherlandsNew CaledoniaNew ZealandNicaraguaNigerNigeriaNorth AmericaNorwayOECD membersOmanOther small statesPacific island small statesPakistanPanamaPapua New GuineaParaguayPeruPhilippinesPolandPortugalPost-demographic dividendPre-demographic dividendQatarRomaniaRussian FederationRwandaSamoaSaudi ArabiaSenegalSerbiaSierra LeoneSingaporeSlovak RepublicSloveniaSmall statesSomaliaSouth AfricaSouth AsiaSouth Asia (IDA & IBRD)SpainSri LankaSt. Kitts and NevisSt. LuciaSt. Vincent and the GrenadinesSub-Saharan Africa Sub-Saharan Africa (excluding high income)Sub-Saharan Africa (IDA & IBRD countries)SudanSurinameSwedenSwitzerlandSyrian Arab RepublicTanzaniaThailandTogoTrinidad and TobagoTunisiaTurkeyUgandaUkraineUnited Arab EmiratesUnited KingdomUnited StatesUpper middle incomeUruguayVenezuela, RBVietnamWorldYemen, Rep.ZambiaZimbabwe Timeline:
This timeline shows a graph from 1964 to 2015 of Belize. No data until 1963. Number of actual observations by date: 51.
Source name:
World Development Indicators
Source organization:
World Bank staff estimates based data from International Monetary Fund's Direction of Trade database.
Categories, topics:
Private Sector, Trade
Last updated:
apr 23, 2017
Indicators value changes by year
At the date of observation
Value
Absolute change
Change from previous value
jan 1, 1964
11.688
+11.688
0.0%
jan 1, 1965
12.996
+1.308
11.19%
jan 1, 1966
15.548
+2.552
19.64%
jan 1, 1967
19.109
+3.56
22.9%
jan 1, 1968
18.979
-0.13
-0.68%
jan 1, 1969
20.639
+1.66
8.75%
jan 1, 1970
25.116
+4.477
21.69%
jan 1, 1971
26.891
+1.775
7.07%
jan 1, 1972
22.512
-4.379
-16.28%
jan 1, 1973
1.318
-21.194
-94.15%
jan 1, 1974
1.183
-0.135
-10.24%
jan 1, 1975
1.178
-0.005
-0.41%
jan 1, 1976
16.771
+15.593
1.32K%
jan 1, 1977
26.783
+10.012
59.7%
jan 1, 1978
21.198
-5.586
-20.85%
jan 1, 1979
43.35
+22.153
104.5%
jan 1, 1980
29.352
-13.999
-32.29%
jan 1, 1982
2.635
-26.717
-91.02%
jan 1, 1983
32.956
+30.321
1.15K%
jan 1, 1984
17.761
-15.195
-46.11%
jan 1, 1985
19.391
+1.631
9.18%
jan 1, 1986
25.055
+5.663
29.21%
jan 1, 1987
12.72
-12.335
-49.23%
jan 1, 1988
13.562
+0.842
6.62%
jan 1, 1989
18.188
+4.626
34.11%
jan 1, 1990
22.191
+4.003
22.01%
jan 1, 1991
15.913
-6.278
-28.29%
jan 1, 1992
7.488
-8.425
-52.94%
jan 1, 1993
5.08
-2.408
-32.15%
jan 1, 1994
11.845
+6.764
133.14%
jan 1, 1995
10.428
-1.416
-11.96%
jan 1, 1996
4.667
-5.762
-55.25%
jan 1, 1997
5.605
+0.938
20.1%
jan 1, 1998
7.77
+2.165
38.64%
jan 1, 1999
5.256
-2.514
-32.35%
jan 1, 2000
4.929
-0.327
-6.22%
jan 1, 2001
4.03
-0.899
-18.25%
jan 1, 2002
5.598
+1.569
38.93%
jan 1, 2003
14.712
+9.114
162.79%
jan 1, 2004
20.643
+5.931
40.31%
jan 1, 2005
14.906
-5.737
-27.79%
jan 1, 2006
9.035
-5.871
-39.39%
jan 1, 2007
13.089
+4.055
44.88%
jan 1, 2008
18.589
+5.5
42.02%
jan 1, 2009
11.962
-6.627
-35.65%
jan 1, 2010
19.138
+7.176
59.99%
jan 1, 2011
19.531
+0.393
2.05%
jan 1, 2012
12.66
-6.871
-35.18%
jan 1, 2013
7.863
-4.797
-37.89%
jan 1, 2014
9.528
+1.665
21.17%
jan 1, 2015
14.444
+4.916
51.6%
Ranking of countries by current statistics by years


Comments: