29
/
en
AIzaSyAYiBZKx7MnpbEhh9jyipgxe19OcubqV5w
April 1, 2024
234878
Saudi Arabia
SAU
true
2
1
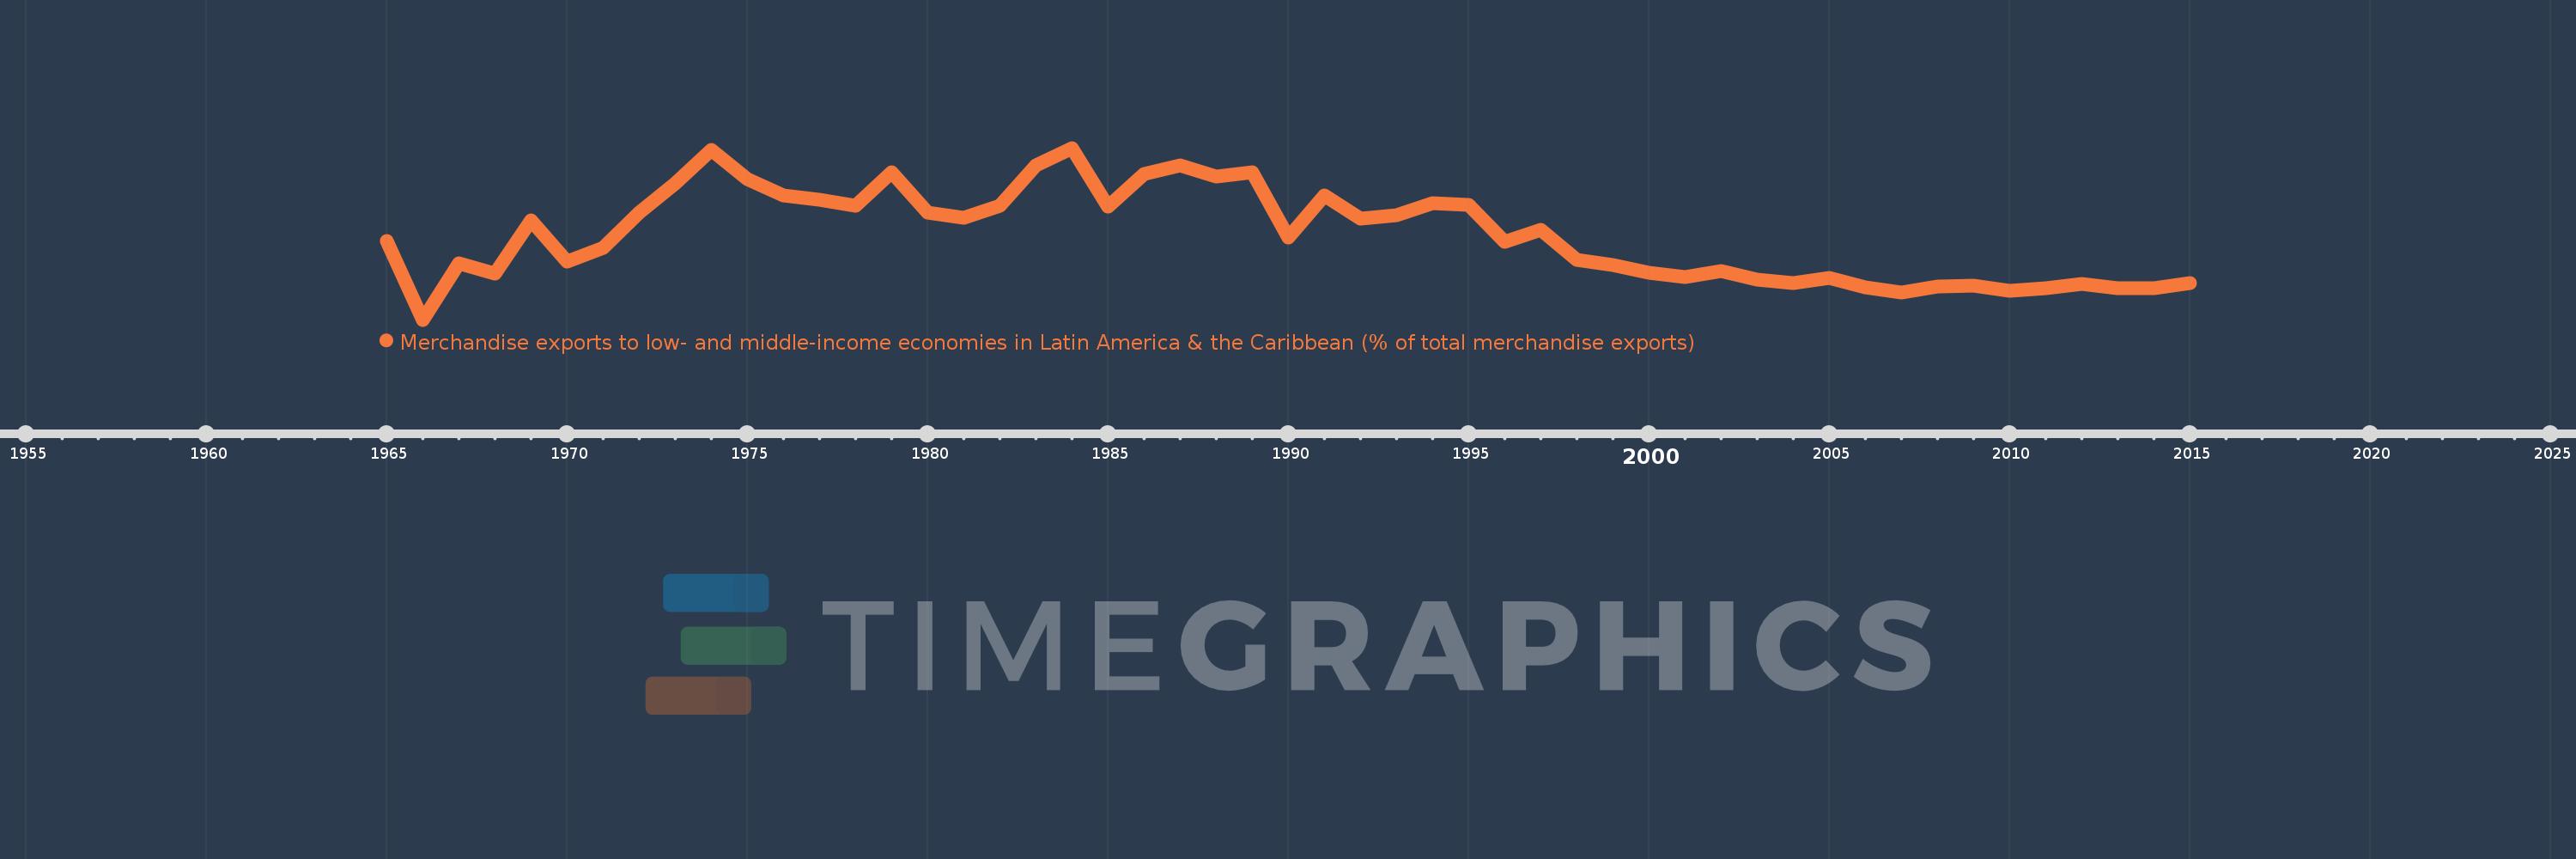
Merchandise exports to low- and middle-income economies in Latin America & the Caribbean (% of total merchandise exports)
2015,2014,2013,2012,2011,2010,2009,2008,2007,2006,2005,2004,2003,2002,2001,2000,1999,1998,1997,1996,1995,1994,1993,1992,1991,1990,1989,1988,1987,1986,1985,1984,1983,1982,1981,1980,1979,1978,1977,1976,1975,1974,1973,1972,1971,1970,1969,1968,1967,1966,1965
This statistics in other country:
AfghanistanAlbaniaAlgeriaAngolaAntigua and BarbudaArab WorldArgentinaArmeniaArubaAustraliaAustriaAzerbaijanBahamas, TheBahrainBangladeshBarbadosBelarusBelgiumBelizeBeninBermudaBoliviaBrazilBrunei DarussalamBulgariaBurundiCabo VerdeCambodiaCameroonCanadaCaribbean small statesCentral African RepublicCentral Europe and the BalticsChileChinaColombiaCongo, Dem. Rep.Congo, Rep.Costa RicaCote d'IvoireCroatiaCubaCyprusCzech RepublicDenmarkDominicaDominican RepublicEarly-demographic dividendEast Asia & PacificEast Asia & Pacific (excluding high income)East Asia & Pacific (IDA & IBRD countries)EcuadorEgypt, Arab Rep.El SalvadorEstoniaEthiopiaEuro areaEurope & Central AsiaEurope & Central Asia (excluding high income)Europe & Central Asia (IDA & IBRD countries)European UnionFaroe IslandsFijiFinlandFragile and conflict affected situationsFranceFrench PolynesiaGabonGambia, TheGeorgiaGermanyGhanaGibraltarGreeceGreenlandGrenadaGuatemalaGuineaGuyanaHaitiHeavily indebted poor countries (HIPC)High incomeHondurasHong Kong SAR, ChinaHungaryIBRD onlyIcelandIDA & IBRD totalIDA blendIDA onlyIDA totalIndiaIndonesiaIran, Islamic Rep.IraqIrelandIsraelItalyJamaicaJapanJordanKazakhstanKenyaKorea, Dem. People’s Rep.Korea, Rep.KuwaitLao PDRLate-demographic dividendLatin America & Caribbean Latin America & Caribbean (excluding high income)Latin America & the Caribbean (IDA & IBRD countries)LatviaLeast developed countries: UN classificationLebanonLiberiaLibyaLithuaniaLow & middle incomeLow incomeLower middle incomeLuxembourgMacao SAR, ChinaMacedonia, FYRMadagascarMalawiMalaysiaMaliMaltaMauritaniaMauritiusMexicoMiddle East & North AfricaMiddle East & North Africa (excluding high income)Middle East & North Africa (IDA & IBRD countries)Middle incomeMongoliaMontenegroMoroccoMozambiqueMyanmarNetherlandsNew CaledoniaNew ZealandNicaraguaNigerNigeriaNorth AmericaNorwayOECD membersOmanOther small statesPacific island small statesPakistanPanamaPapua New GuineaParaguayPeruPhilippinesPolandPortugalPost-demographic dividendPre-demographic dividendQatarRomaniaRussian FederationRwandaSamoaSaudi ArabiaSenegalSerbiaSierra LeoneSingaporeSlovak RepublicSloveniaSmall statesSomaliaSouth AfricaSouth AsiaSouth Asia (IDA & IBRD)SpainSri LankaSt. Kitts and NevisSt. LuciaSt. Vincent and the GrenadinesSub-Saharan Africa Sub-Saharan Africa (excluding high income)Sub-Saharan Africa (IDA & IBRD countries)SudanSurinameSwedenSwitzerlandSyrian Arab RepublicTanzaniaThailandTogoTrinidad and TobagoTunisiaTurkeyUgandaUkraineUnited Arab EmiratesUnited KingdomUnited StatesUpper middle incomeUruguayVenezuela, RBVietnamWorldYemen, Rep.ZambiaZimbabwe Timeline:
This timeline shows a graph from 1965 to 2015 of Saudi Arabia. No data until 1964. Number of actual observations by date: 51.
Source name:
World Development Indicators
Source organization:
World Bank staff estimates based data from International Monetary Fund's Direction of Trade database.
Categories, topics:
Private Sector, Trade
Last updated:
apr 23, 2017
Indicators value changes by year
At the date of observation
Value
Absolute change
Change from previous value
jan 1, 1965
2.241
+2.241
0.0%
jan 1, 1966
0.372
-1.869
-83.39%
jan 1, 1967
1.698
+1.325
356.02%
jan 1, 1968
1.46
-0.238
-14.01%
jan 1, 1969
2.72
+1.26
86.3%
jan 1, 1970
1.74
-0.98
-36.02%
jan 1, 1971
2.082
+0.342
19.67%
jan 1, 1972
2.907
+0.825
39.62%
jan 1, 1973
3.599
+0.691
23.78%
jan 1, 1974
4.386
+0.788
21.88%
jan 1, 1975
3.7
-0.686
-15.64%
jan 1, 1976
3.316
-0.384
-10.39%
jan 1, 1977
3.212
-0.104
-3.13%
jan 1, 1978
3.072
-0.14
-4.35%
jan 1, 1979
3.866
+0.793
25.82%
jan 1, 1980
2.902
-0.963
-24.92%
jan 1, 1981
2.782
-0.12
-4.15%
jan 1, 1982
3.078
+0.296
10.63%
jan 1, 1983
4.026
+0.948
30.8%
jan 1, 1984
4.437
+0.411
10.21%
jan 1, 1985
3.058
-1.379
-31.08%
jan 1, 1986
3.823
+0.765
25.02%
jan 1, 1987
4.028
+0.205
5.37%
jan 1, 1988
3.751
-0.278
-6.89%
jan 1, 1989
3.863
+0.112
2.98%
jan 1, 1990
2.315
-1.547
-40.06%
jan 1, 1991
3.305
+0.989
42.73%
jan 1, 1992
2.769
-0.536
-16.21%
jan 1, 1993
2.852
+0.082
2.98%
jan 1, 1994
3.131
+0.279
9.79%
jan 1, 1995
3.094
-0.036
-1.17%
jan 1, 1996
2.206
-0.888
-28.7%
jan 1, 1997
2.499
+0.293
13.27%
jan 1, 1998
1.779
-0.72
-28.8%
jan 1, 1999
1.661
-0.118
-6.66%
jan 1, 2000
1.478
-0.183
-11.02%
jan 1, 2001
1.382
-0.096
-6.46%
jan 1, 2002
1.533
+0.151
10.9%
jan 1, 2003
1.326
-0.207
-13.51%
jan 1, 2004
1.247
-0.079
-5.95%
jan 1, 2005
1.359
+0.112
9.02%
jan 1, 2006
1.137
-0.222
-16.34%
jan 1, 2007
1.026
-0.111
-9.77%
jan 1, 2008
1.166
+0.14
13.69%
jan 1, 2009
1.185
+0.019
1.61%
jan 1, 2010
1.052
-0.134
-11.26%
jan 1, 2011
1.112
+0.06
5.7%
jan 1, 2012
1.222
+0.111
9.97%
jan 1, 2013
1.111
-0.112
-9.14%
jan 1, 2014
1.125
+0.014
1.25%
jan 1, 2015
1.246
+0.122
10.81%
Ranking of countries by current statistics by years


Comments: