29
/
en
AIzaSyAYiBZKx7MnpbEhh9jyipgxe19OcubqV5w
April 1, 2024
42615
Latin America & Caribbean (excluding high income)
LAC
false
2
1
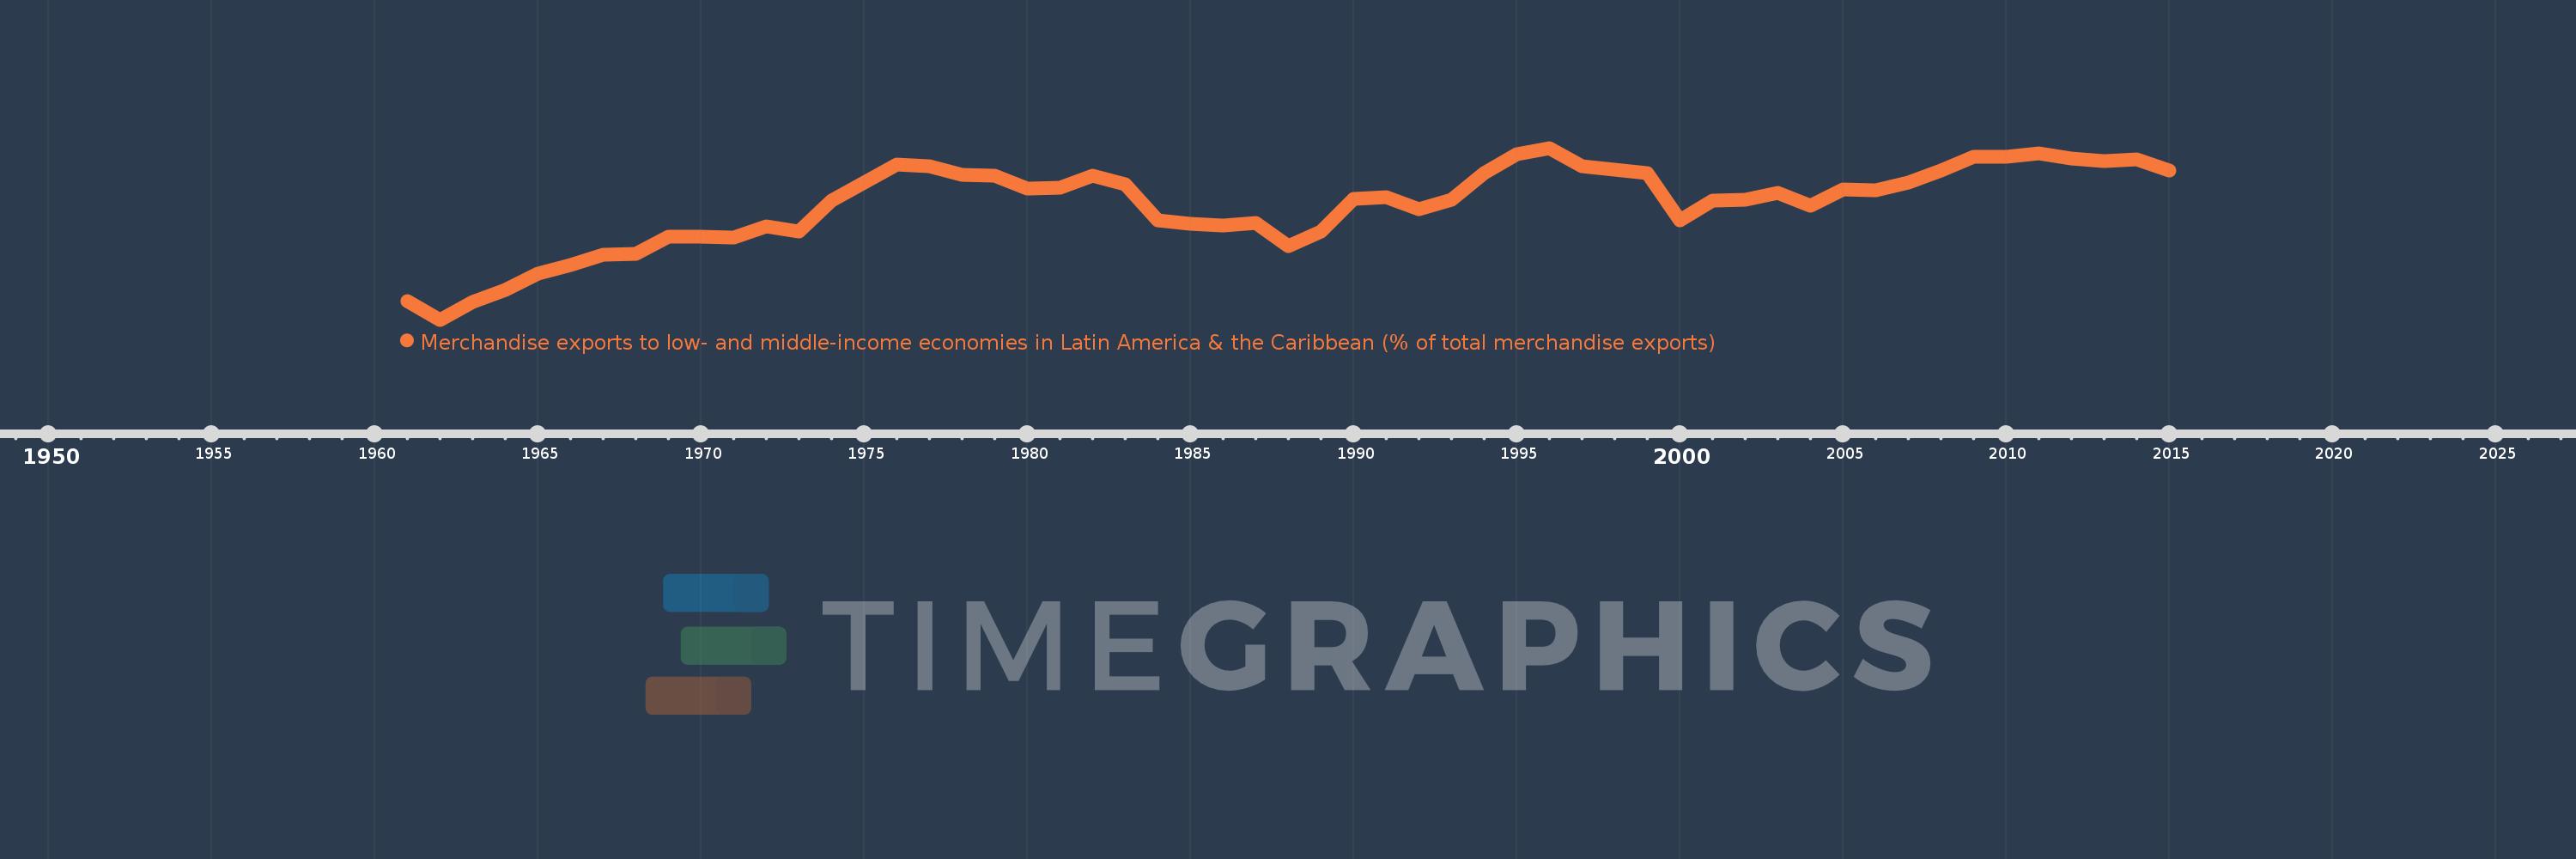
Merchandise exports to low- and middle-income economies in Latin America & the Caribbean (% of total merchandise exports)
2015,2014,2013,2012,2011,2010,2009,2008,2007,2006,2005,2004,2003,2002,2001,2000,1999,1998,1997,1996,1995,1994,1993,1992,1991,1990,1989,1988,1987,1986,1985,1984,1983,1982,1981,1980,1979,1978,1977,1976,1975,1974,1973,1972,1971,1970,1969,1968,1967,1966,1965,1964,1963,1962,1961
This statistics in other country:
AfghanistanAlbaniaAlgeriaAngolaAntigua and BarbudaArab WorldArgentinaArmeniaArubaAustraliaAustriaAzerbaijanBahamas, TheBahrainBangladeshBarbadosBelarusBelgiumBelizeBeninBermudaBoliviaBrazilBrunei DarussalamBulgariaBurundiCabo VerdeCambodiaCameroonCanadaCaribbean small statesCentral African RepublicCentral Europe and the BalticsChileChinaColombiaCongo, Dem. Rep.Congo, Rep.Costa RicaCote d'IvoireCroatiaCubaCyprusCzech RepublicDenmarkDominicaDominican RepublicEarly-demographic dividendEast Asia & PacificEast Asia & Pacific (excluding high income)East Asia & Pacific (IDA & IBRD countries)EcuadorEgypt, Arab Rep.El SalvadorEstoniaEthiopiaEuro areaEurope & Central AsiaEurope & Central Asia (excluding high income)Europe & Central Asia (IDA & IBRD countries)European UnionFaroe IslandsFijiFinlandFragile and conflict affected situationsFranceFrench PolynesiaGabonGambia, TheGeorgiaGermanyGhanaGibraltarGreeceGreenlandGrenadaGuatemalaGuineaGuyanaHaitiHeavily indebted poor countries (HIPC)High incomeHondurasHong Kong SAR, ChinaHungaryIBRD onlyIcelandIDA & IBRD totalIDA blendIDA onlyIDA totalIndiaIndonesiaIran, Islamic Rep.IraqIrelandIsraelItalyJamaicaJapanJordanKazakhstanKenyaKorea, Dem. People’s Rep.Korea, Rep.KuwaitLao PDRLate-demographic dividendLatin America & Caribbean Latin America & Caribbean (excluding high income)Latin America & the Caribbean (IDA & IBRD countries)LatviaLeast developed countries: UN classificationLebanonLiberiaLibyaLithuaniaLow & middle incomeLow incomeLower middle incomeLuxembourgMacao SAR, ChinaMacedonia, FYRMadagascarMalawiMalaysiaMaliMaltaMauritaniaMauritiusMexicoMiddle East & North AfricaMiddle East & North Africa (excluding high income)Middle East & North Africa (IDA & IBRD countries)Middle incomeMongoliaMontenegroMoroccoMozambiqueMyanmarNetherlandsNew CaledoniaNew ZealandNicaraguaNigerNigeriaNorth AmericaNorwayOECD membersOmanOther small statesPacific island small statesPakistanPanamaPapua New GuineaParaguayPeruPhilippinesPolandPortugalPost-demographic dividendPre-demographic dividendQatarRomaniaRussian FederationRwandaSamoaSaudi ArabiaSenegalSerbiaSierra LeoneSingaporeSlovak RepublicSloveniaSmall statesSomaliaSouth AfricaSouth AsiaSouth Asia (IDA & IBRD)SpainSri LankaSt. Kitts and NevisSt. LuciaSt. Vincent and the GrenadinesSub-Saharan Africa Sub-Saharan Africa (excluding high income)Sub-Saharan Africa (IDA & IBRD countries)SudanSurinameSwedenSwitzerlandSyrian Arab RepublicTanzaniaThailandTogoTrinidad and TobagoTunisiaTurkeyUgandaUkraineUnited Arab EmiratesUnited KingdomUnited StatesUpper middle incomeUruguayVenezuela, RBVietnamWorldYemen, Rep.ZambiaZimbabwe Timeline:
This timeline shows a graph from 1961 to 2015 of Latin America & Caribbean (excluding high income). No data until 1960. Number of actual observations by date: 55.
Source name:
World Development Indicators
Source organization:
World Bank staff estimates based data from International Monetary Fund's Direction of Trade database.
Categories, topics:
Private Sector, Trade
Last updated:
apr 23, 2017
Indicators value changes by year
Maximum:
12.413
jan 1, 1996
At the date of observation
Value
Absolute change
Change from previous value
jan 1, 1961
4.498
+4.498
0.0%
jan 1, 1962
3.546
-0.952
-21.16%
jan 1, 1963
4.471
+0.925
26.09%
jan 1, 1964
5.092
+0.62
13.87%
jan 1, 1965
5.937
+0.845
16.6%
jan 1, 1966
6.387
+0.451
7.59%
jan 1, 1967
6.902
+0.515
8.06%
jan 1, 1968
6.93
+0.028
0.4%
jan 1, 1969
7.813
+0.883
12.74%
jan 1, 1970
7.814
+0.001
0.01%
jan 1, 1971
7.801
-0.013
-0.17%
jan 1, 1972
8.363
+0.562
7.2%
jan 1, 1973
8.104
-0.259
-3.09%
jan 1, 1974
9.681
+1.577
19.46%
jan 1, 1975
10.63
+0.949
9.8%
jan 1, 1976
11.574
+0.944
8.88%
jan 1, 1977
11.47
-0.104
-0.9%
jan 1, 1978
11.011
-0.459
-4.0%
jan 1, 1979
10.978
-0.033
-0.3%
jan 1, 1980
10.302
-0.676
-6.16%
jan 1, 1981
10.362
+0.06
0.58%
jan 1, 1982
10.975
+0.613
5.91%
jan 1, 1983
10.535
-0.441
-4.02%
jan 1, 1984
8.671
-1.864
-17.69%
jan 1, 1985
8.489
-0.182
-2.1%
jan 1, 1986
8.394
-0.095
-1.11%
jan 1, 1987
8.529
+0.134
1.6%
jan 1, 1988
7.344
-1.185
-13.89%
jan 1, 1989
8.104
+0.76
10.35%
jan 1, 1990
9.773
+1.67
20.6%
jan 1, 1991
9.882
+0.109
1.11%
jan 1, 1992
9.243
-0.639
-6.47%
jan 1, 1993
9.75
+0.506
5.48%
jan 1, 1994
11.099
+1.35
13.84%
jan 1, 1995
12.095
+0.996
8.97%
jan 1, 1996
12.413
+0.317
2.62%
jan 1, 1997
11.453
-0.96
-7.73%
jan 1, 1998
11.31
-0.142
-1.24%
jan 1, 1999
11.131
-0.179
-1.58%
jan 1, 2000
8.688
-2.443
-21.95%
jan 1, 2001
9.686
+0.997
11.48%
jan 1, 2002
9.723
+0.038
0.39%
jan 1, 2003
10.081
+0.357
3.68%
jan 1, 2004
9.429
-0.652
-6.47%
jan 1, 2005
10.281
+0.852
9.04%
jan 1, 2006
10.249
-0.032
-0.32%
jan 1, 2007
10.617
+0.368
3.59%
jan 1, 2008
11.226
+0.609
5.74%
jan 1, 2009
11.936
+0.71
6.32%
jan 1, 2010
11.971
+0.036
0.3%
jan 1, 2011
12.134
+0.162
1.36%
jan 1, 2012
11.857
-0.277
-2.28%
jan 1, 2013
11.726
-0.131
-1.1%
jan 1, 2014
11.816
+0.09
0.77%
jan 1, 2015
11.265
-0.551
-4.67%
Ranking of countries by current statistics by years


Comments: