29
/
en
AIzaSyAYiBZKx7MnpbEhh9jyipgxe19OcubqV5w
April 1, 2024
101334
Canada
CAN
true
2
1
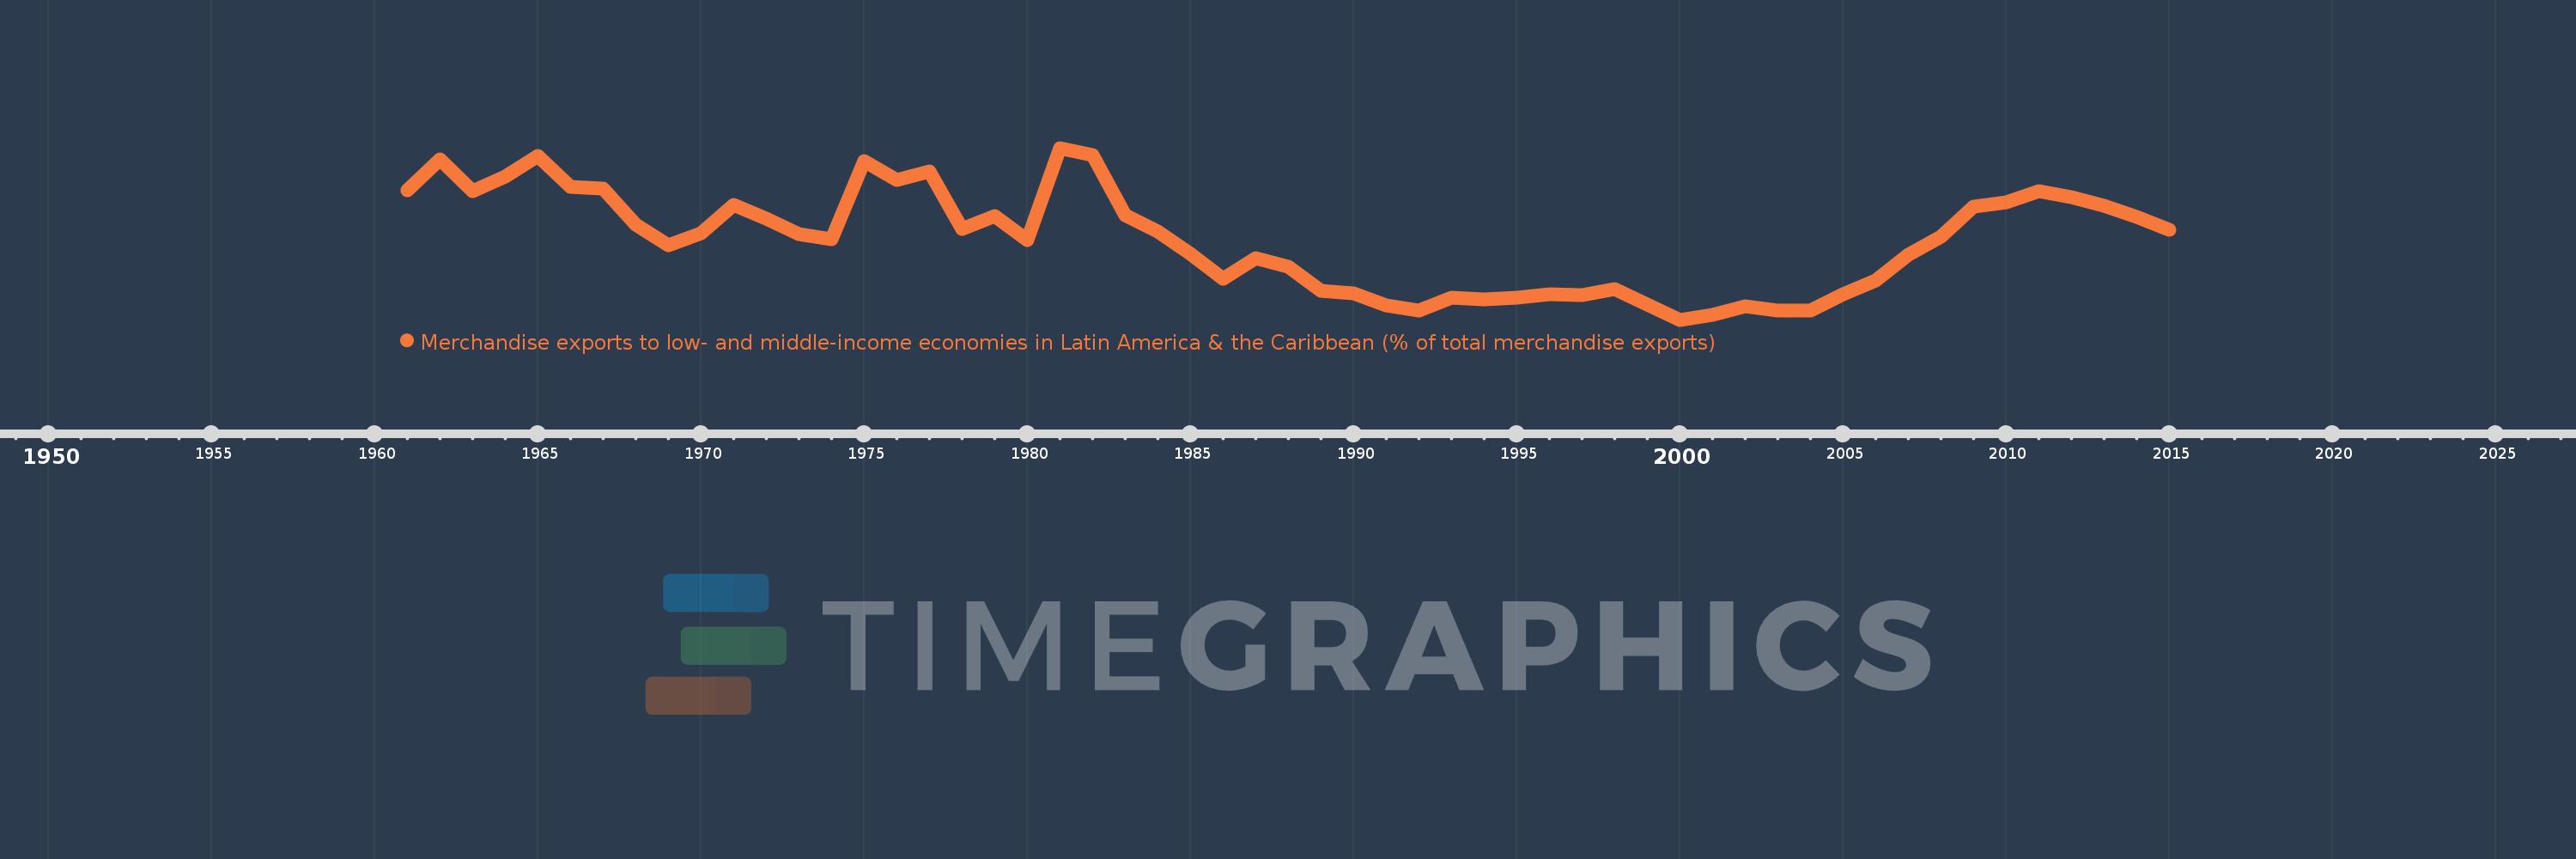
Merchandise exports to low- and middle-income economies in Latin America & the Caribbean (% of total merchandise exports)
2015,2014,2013,2012,2011,2010,2009,2008,2007,2006,2005,2004,2003,2002,2001,2000,1999,1998,1997,1996,1995,1994,1993,1992,1991,1990,1989,1988,1987,1986,1985,1984,1983,1982,1981,1980,1979,1978,1977,1976,1975,1974,1973,1972,1971,1970,1969,1968,1967,1966,1965,1964,1963,1962,1961
Global statistics library →Canada →Merchandise exports to low- and middle-income economies in Latin America & the Caribbean (% of total merchandise exports)
This statistics in other country:
AfghanistanAlbaniaAlgeriaAngolaAntigua and BarbudaArab WorldArgentinaArmeniaArubaAustraliaAustriaAzerbaijanBahamas, TheBahrainBangladeshBarbadosBelarusBelgiumBelizeBeninBermudaBoliviaBrazilBrunei DarussalamBulgariaBurundiCabo VerdeCambodiaCameroonCanadaCaribbean small statesCentral African RepublicCentral Europe and the BalticsChileChinaColombiaCongo, Dem. Rep.Congo, Rep.Costa RicaCote d'IvoireCroatiaCubaCyprusCzech RepublicDenmarkDominicaDominican RepublicEarly-demographic dividendEast Asia & PacificEast Asia & Pacific (excluding high income)East Asia & Pacific (IDA & IBRD countries)EcuadorEgypt, Arab Rep.El SalvadorEstoniaEthiopiaEuro areaEurope & Central AsiaEurope & Central Asia (excluding high income)Europe & Central Asia (IDA & IBRD countries)European UnionFaroe IslandsFijiFinlandFragile and conflict affected situationsFranceFrench PolynesiaGabonGambia, TheGeorgiaGermanyGhanaGibraltarGreeceGreenlandGrenadaGuatemalaGuineaGuyanaHaitiHeavily indebted poor countries (HIPC)High incomeHondurasHong Kong SAR, ChinaHungaryIBRD onlyIcelandIDA & IBRD totalIDA blendIDA onlyIDA totalIndiaIndonesiaIran, Islamic Rep.IraqIrelandIsraelItalyJamaicaJapanJordanKazakhstanKenyaKorea, Dem. People’s Rep.Korea, Rep.KuwaitLao PDRLate-demographic dividendLatin America & Caribbean Latin America & Caribbean (excluding high income)Latin America & the Caribbean (IDA & IBRD countries)LatviaLeast developed countries: UN classificationLebanonLiberiaLibyaLithuaniaLow & middle incomeLow incomeLower middle incomeLuxembourgMacao SAR, ChinaMacedonia, FYRMadagascarMalawiMalaysiaMaliMaltaMauritaniaMauritiusMexicoMiddle East & North AfricaMiddle East & North Africa (excluding high income)Middle East & North Africa (IDA & IBRD countries)Middle incomeMongoliaMontenegroMoroccoMozambiqueMyanmarNetherlandsNew CaledoniaNew ZealandNicaraguaNigerNigeriaNorth AmericaNorwayOECD membersOmanOther small statesPacific island small statesPakistanPanamaPapua New GuineaParaguayPeruPhilippinesPolandPortugalPost-demographic dividendPre-demographic dividendQatarRomaniaRussian FederationRwandaSamoaSaudi ArabiaSenegalSerbiaSierra LeoneSingaporeSlovak RepublicSloveniaSmall statesSomaliaSouth AfricaSouth AsiaSouth Asia (IDA & IBRD)SpainSri LankaSt. Kitts and NevisSt. LuciaSt. Vincent and the GrenadinesSub-Saharan Africa Sub-Saharan Africa (excluding high income)Sub-Saharan Africa (IDA & IBRD countries)SudanSurinameSwedenSwitzerlandSyrian Arab RepublicTanzaniaThailandTogoTrinidad and TobagoTunisiaTurkeyUgandaUkraineUnited Arab EmiratesUnited KingdomUnited StatesUpper middle incomeUruguayVenezuela, RBVietnamWorldYemen, Rep.ZambiaZimbabwe Timeline:
This timeline shows a graph from 1961 to 2015 of Canada. No data until 1960. Number of actual observations by date: 55.
Source name:
World Development Indicators
Source organization:
World Bank staff estimates based data from International Monetary Fund's Direction of Trade database.
Categories, topics:
Private Sector, Trade
Last updated:
apr 23, 2017
Indicators value changes by year
At the date of observation
Value
Absolute change
Change from previous value
jan 1, 1961
2.606
+2.606
0.0%
jan 1, 1962
2.966
+0.361
13.84%
jan 1, 1963
2.587
-0.379
-12.78%
jan 1, 1964
2.763
+0.176
6.8%
jan 1, 1965
3.016
+0.252
9.13%
jan 1, 1966
2.643
-0.372
-12.34%
jan 1, 1967
2.624
-0.019
-0.72%
jan 1, 1968
2.194
-0.43
-16.39%
jan 1, 1969
1.951
-0.243
-11.08%
jan 1, 1970
2.096
+0.145
7.44%
jan 1, 1971
2.425
+0.329
15.69%
jan 1, 1972
2.262
-0.163
-6.72%
jan 1, 1973
2.077
-0.186
-8.21%
jan 1, 1974
2.018
-0.058
-2.8%
jan 1, 1975
2.945
+0.927
45.9%
jan 1, 1976
2.726
-0.219
-7.45%
jan 1, 1977
2.823
+0.098
3.58%
jan 1, 1978
2.145
-0.679
-24.04%
jan 1, 1979
2.293
+0.148
6.9%
jan 1, 1980
2.014
-0.278
-12.13%
jan 1, 1981
3.106
+1.092
54.21%
jan 1, 1982
3.017
-0.09
-2.89%
jan 1, 1983
2.307
-0.71
-23.54%
jan 1, 1984
2.109
-0.197
-8.55%
jan 1, 1985
1.843
-0.267
-12.65%
jan 1, 1986
1.553
-0.289
-15.7%
jan 1, 1987
1.791
+0.237
15.29%
jan 1, 1988
1.691
-0.1
-5.56%
jan 1, 1989
1.403
-0.288
-17.03%
jan 1, 1990
1.38
-0.023
-1.67%
jan 1, 1991
1.231
-0.149
-10.78%
jan 1, 1992
1.169
-0.062
-5.04%
jan 1, 1993
1.325
+0.156
13.32%
jan 1, 1994
1.302
-0.023
-1.71%
jan 1, 1995
1.326
+0.024
1.85%
jan 1, 1996
1.363
+0.037
2.79%
jan 1, 1997
1.358
-0.005
-0.34%
jan 1, 1998
1.422
+0.063
4.67%
jan 1, 1999
1.247
-0.175
-12.31%
jan 1, 2000
1.062
-0.185
-14.81%
jan 1, 2001
1.121
+0.059
5.53%
jan 1, 2002
1.224
+0.103
9.17%
jan 1, 2003
1.174
-0.05
-4.1%
jan 1, 2004
1.169
-0.005
-0.42%
jan 1, 2005
1.366
+0.197
16.9%
jan 1, 2006
1.525
+0.159
11.66%
jan 1, 2007
1.836
+0.31
20.35%
jan 1, 2008
2.052
+0.217
11.8%
jan 1, 2009
2.413
+0.361
17.57%
jan 1, 2010
2.458
+0.045
1.87%
jan 1, 2011
2.588
+0.13
5.28%
jan 1, 2012
2.522
-0.066
-2.56%
jan 1, 2013
2.417
-0.104
-4.14%
jan 1, 2014
2.286
-0.132
-5.45%
jan 1, 2015
2.13
-0.156
-6.81%
Ranking of countries by current statistics by years


Comments: