29
/
en
AIzaSyAYiBZKx7MnpbEhh9jyipgxe19OcubqV5w
April 1, 2024
209548
New Zealand
NZL
true
2
1
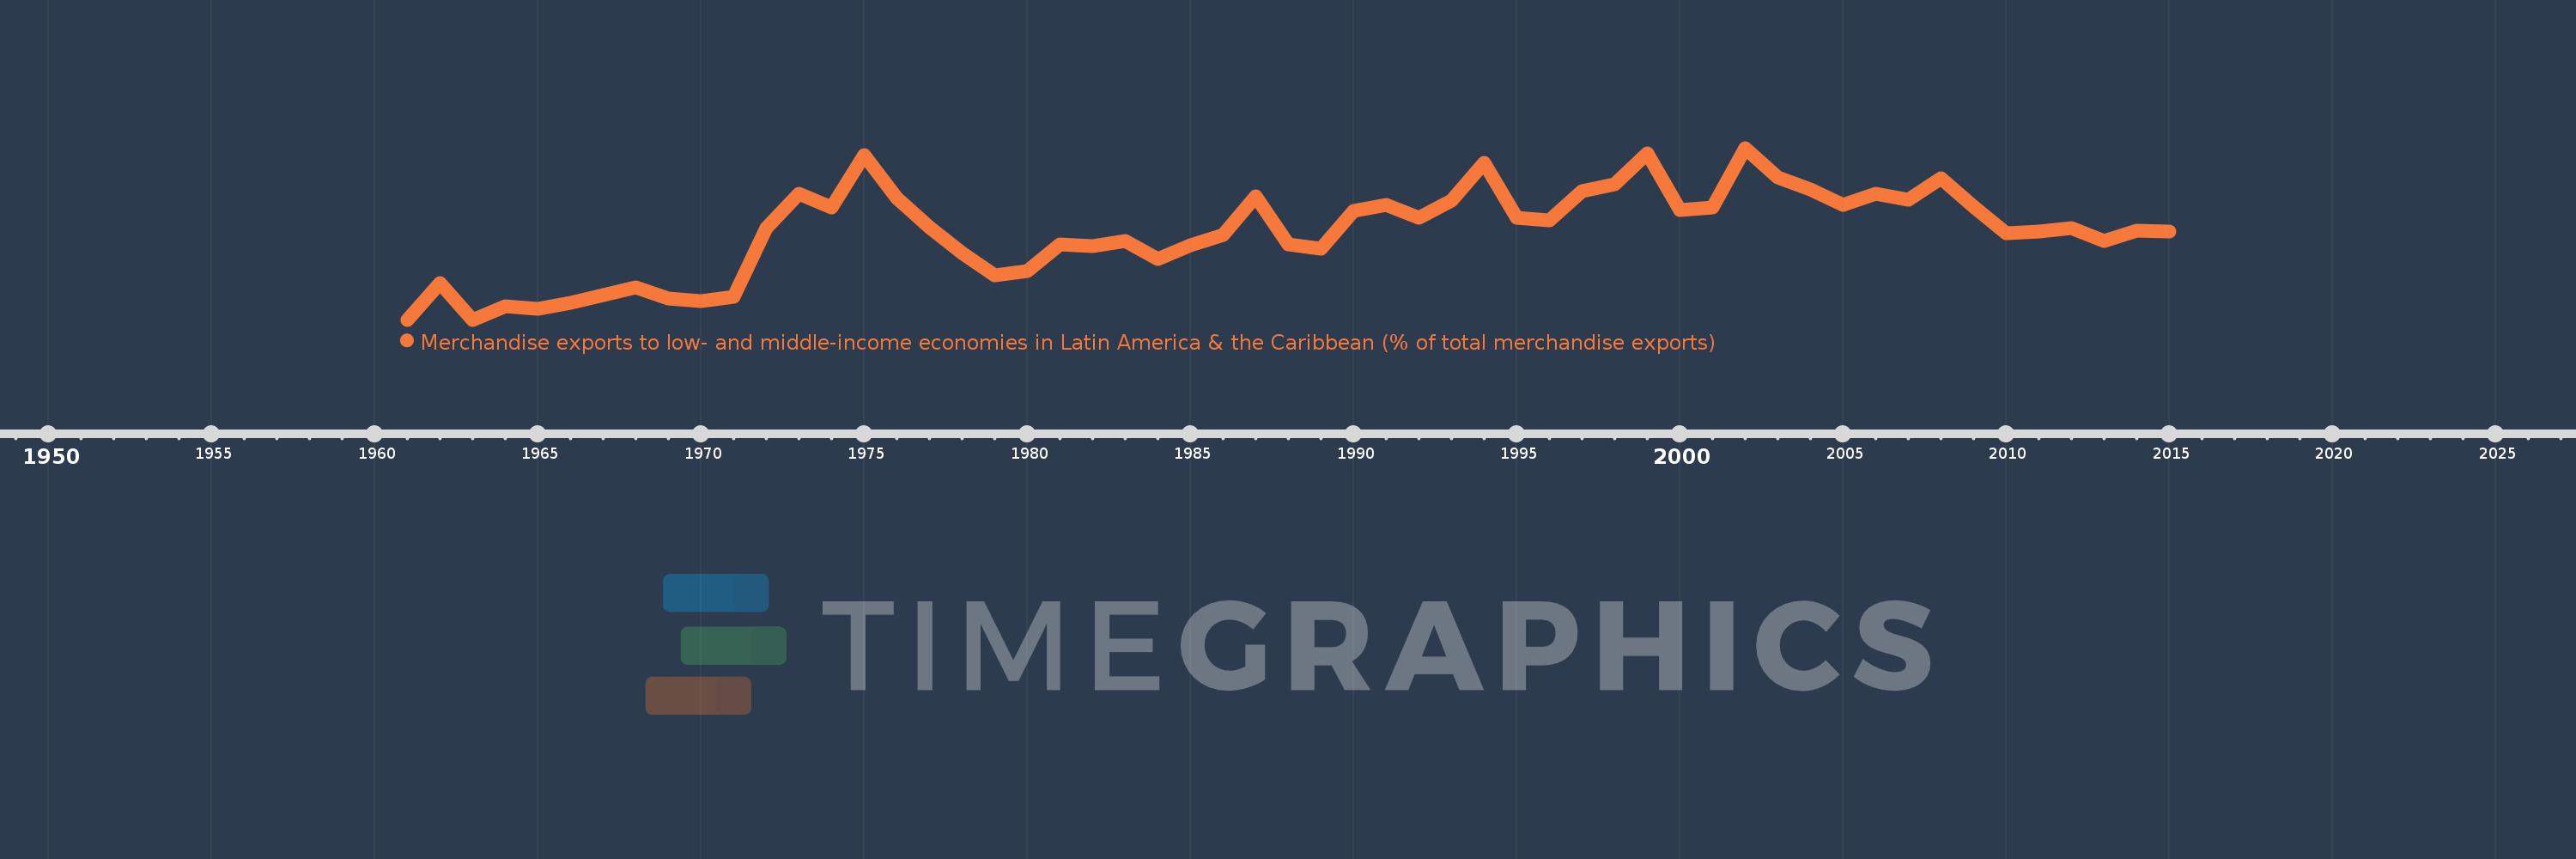
Merchandise exports to low- and middle-income economies in Latin America & the Caribbean (% of total merchandise exports)
2015,2014,2013,2012,2011,2010,2009,2008,2007,2006,2005,2004,2003,2002,2001,2000,1999,1998,1997,1996,1995,1994,1993,1992,1991,1990,1989,1988,1987,1986,1985,1984,1983,1982,1981,1980,1979,1978,1977,1976,1975,1974,1973,1972,1971,1970,1969,1968,1967,1966,1965,1964,1963,1962,1961
This statistics in other country:
AfghanistanAlbaniaAlgeriaAngolaAntigua and BarbudaArab WorldArgentinaArmeniaArubaAustraliaAustriaAzerbaijanBahamas, TheBahrainBangladeshBarbadosBelarusBelgiumBelizeBeninBermudaBoliviaBrazilBrunei DarussalamBulgariaBurundiCabo VerdeCambodiaCameroonCanadaCaribbean small statesCentral African RepublicCentral Europe and the BalticsChileChinaColombiaCongo, Dem. Rep.Congo, Rep.Costa RicaCote d'IvoireCroatiaCubaCyprusCzech RepublicDenmarkDominicaDominican RepublicEarly-demographic dividendEast Asia & PacificEast Asia & Pacific (excluding high income)East Asia & Pacific (IDA & IBRD countries)EcuadorEgypt, Arab Rep.El SalvadorEstoniaEthiopiaEuro areaEurope & Central AsiaEurope & Central Asia (excluding high income)Europe & Central Asia (IDA & IBRD countries)European UnionFaroe IslandsFijiFinlandFragile and conflict affected situationsFranceFrench PolynesiaGabonGambia, TheGeorgiaGermanyGhanaGibraltarGreeceGreenlandGrenadaGuatemalaGuineaGuyanaHaitiHeavily indebted poor countries (HIPC)High incomeHondurasHong Kong SAR, ChinaHungaryIBRD onlyIcelandIDA & IBRD totalIDA blendIDA onlyIDA totalIndiaIndonesiaIran, Islamic Rep.IraqIrelandIsraelItalyJamaicaJapanJordanKazakhstanKenyaKorea, Dem. People’s Rep.Korea, Rep.KuwaitLao PDRLate-demographic dividendLatin America & Caribbean Latin America & Caribbean (excluding high income)Latin America & the Caribbean (IDA & IBRD countries)LatviaLeast developed countries: UN classificationLebanonLiberiaLibyaLithuaniaLow & middle incomeLow incomeLower middle incomeLuxembourgMacao SAR, ChinaMacedonia, FYRMadagascarMalawiMalaysiaMaliMaltaMauritaniaMauritiusMexicoMiddle East & North AfricaMiddle East & North Africa (excluding high income)Middle East & North Africa (IDA & IBRD countries)Middle incomeMongoliaMontenegroMoroccoMozambiqueMyanmarNetherlandsNew CaledoniaNew ZealandNicaraguaNigerNigeriaNorth AmericaNorwayOECD membersOmanOther small statesPacific island small statesPakistanPanamaPapua New GuineaParaguayPeruPhilippinesPolandPortugalPost-demographic dividendPre-demographic dividendQatarRomaniaRussian FederationRwandaSamoaSaudi ArabiaSenegalSerbiaSierra LeoneSingaporeSlovak RepublicSloveniaSmall statesSomaliaSouth AfricaSouth AsiaSouth Asia (IDA & IBRD)SpainSri LankaSt. Kitts and NevisSt. LuciaSt. Vincent and the GrenadinesSub-Saharan Africa Sub-Saharan Africa (excluding high income)Sub-Saharan Africa (IDA & IBRD countries)SudanSurinameSwedenSwitzerlandSyrian Arab RepublicTanzaniaThailandTogoTrinidad and TobagoTunisiaTurkeyUgandaUkraineUnited Arab EmiratesUnited KingdomUnited StatesUpper middle incomeUruguayVenezuela, RBVietnamWorldYemen, Rep.ZambiaZimbabwe Timeline:
This timeline shows a graph from 1961 to 2015 of New Zealand. No data until 1960. Number of actual observations by date: 55.
Source name:
World Development Indicators
Source organization:
World Bank staff estimates based data from International Monetary Fund's Direction of Trade database.
Categories, topics:
Private Sector, Trade
Last updated:
apr 23, 2017
Indicators value changes by year
At the date of observation
Value
Absolute change
Change from previous value
jan 1, 1962
0.733
+0.733
%
jan 1, 1963
0.0
-0.733
-100.0%
jan 1, 1964
0.265
+0.265
%
jan 1, 1965
0.225
-0.04
-15.23%
jan 1, 1966
0.331
+0.107
47.43%
jan 1, 1967
0.502
+0.17
51.32%
jan 1, 1968
0.651
+0.149
29.71%
jan 1, 1969
0.431
-0.22
-33.74%
jan 1, 1970
0.37
-0.061
-14.11%
jan 1, 1971
0.466
+0.095
25.74%
jan 1, 1972
1.84
+1.374
295.08%
jan 1, 1973
2.528
+0.688
37.42%
jan 1, 1974
2.25
-0.278
-11.0%
jan 1, 1975
3.295
+1.045
46.46%
jan 1, 1976
2.431
-0.864
-26.22%
jan 1, 1977
1.857
-0.574
-23.6%
jan 1, 1978
1.336
-0.521
-28.07%
jan 1, 1979
0.888
-0.448
-33.51%
jan 1, 1980
0.981
+0.093
10.46%
jan 1, 1981
1.505
+0.524
53.39%
jan 1, 1982
1.481
-0.024
-1.56%
jan 1, 1983
1.584
+0.103
6.95%
jan 1, 1984
1.212
-0.372
-23.49%
jan 1, 1985
1.486
+0.273
22.55%
jan 1, 1986
1.695
+0.209
14.07%
jan 1, 1987
2.47
+0.775
45.71%
jan 1, 1988
1.515
-0.955
-38.67%
jan 1, 1989
1.43
-0.085
-5.59%
jan 1, 1990
2.184
+0.754
52.71%
jan 1, 1991
2.297
+0.113
5.2%
jan 1, 1992
2.042
-0.255
-11.11%
jan 1, 1993
2.39
+0.348
17.04%
jan 1, 1994
3.144
+0.755
31.58%
jan 1, 1995
2.043
-1.101
-35.03%
jan 1, 1996
1.996
-0.047
-2.28%
jan 1, 1997
2.578
+0.582
29.14%
jan 1, 1998
2.72
+0.142
5.5%
jan 1, 1999
3.338
+0.618
22.73%
jan 1, 2000
2.199
-1.139
-34.13%
jan 1, 2001
2.242
+0.043
1.96%
jan 1, 2002
3.441
+1.199
53.5%
jan 1, 2003
2.851
-0.59
-17.13%
jan 1, 2004
2.617
-0.234
-8.21%
jan 1, 2005
2.302
-0.315
-12.03%
jan 1, 2006
2.528
+0.226
9.8%
jan 1, 2007
2.397
-0.132
-5.21%
jan 1, 2008
2.835
+0.438
18.28%
jan 1, 2009
2.262
-0.572
-20.19%
jan 1, 2010
1.74
-0.522
-23.06%
jan 1, 2011
1.759
+0.019
1.07%
jan 1, 2012
1.84
+0.081
4.62%
jan 1, 2013
1.572
-0.268
-14.57%
jan 1, 2014
1.785
+0.213
13.54%
jan 1, 2015
1.771
-0.014
-0.79%
Ranking of countries by current statistics by years


Comments: