29
/
en
AIzaSyAYiBZKx7MnpbEhh9jyipgxe19OcubqV5w
April 1, 2024
60950
Sub-Saharan Africa (IDA & IBRD countries)
TSS
false
2
1
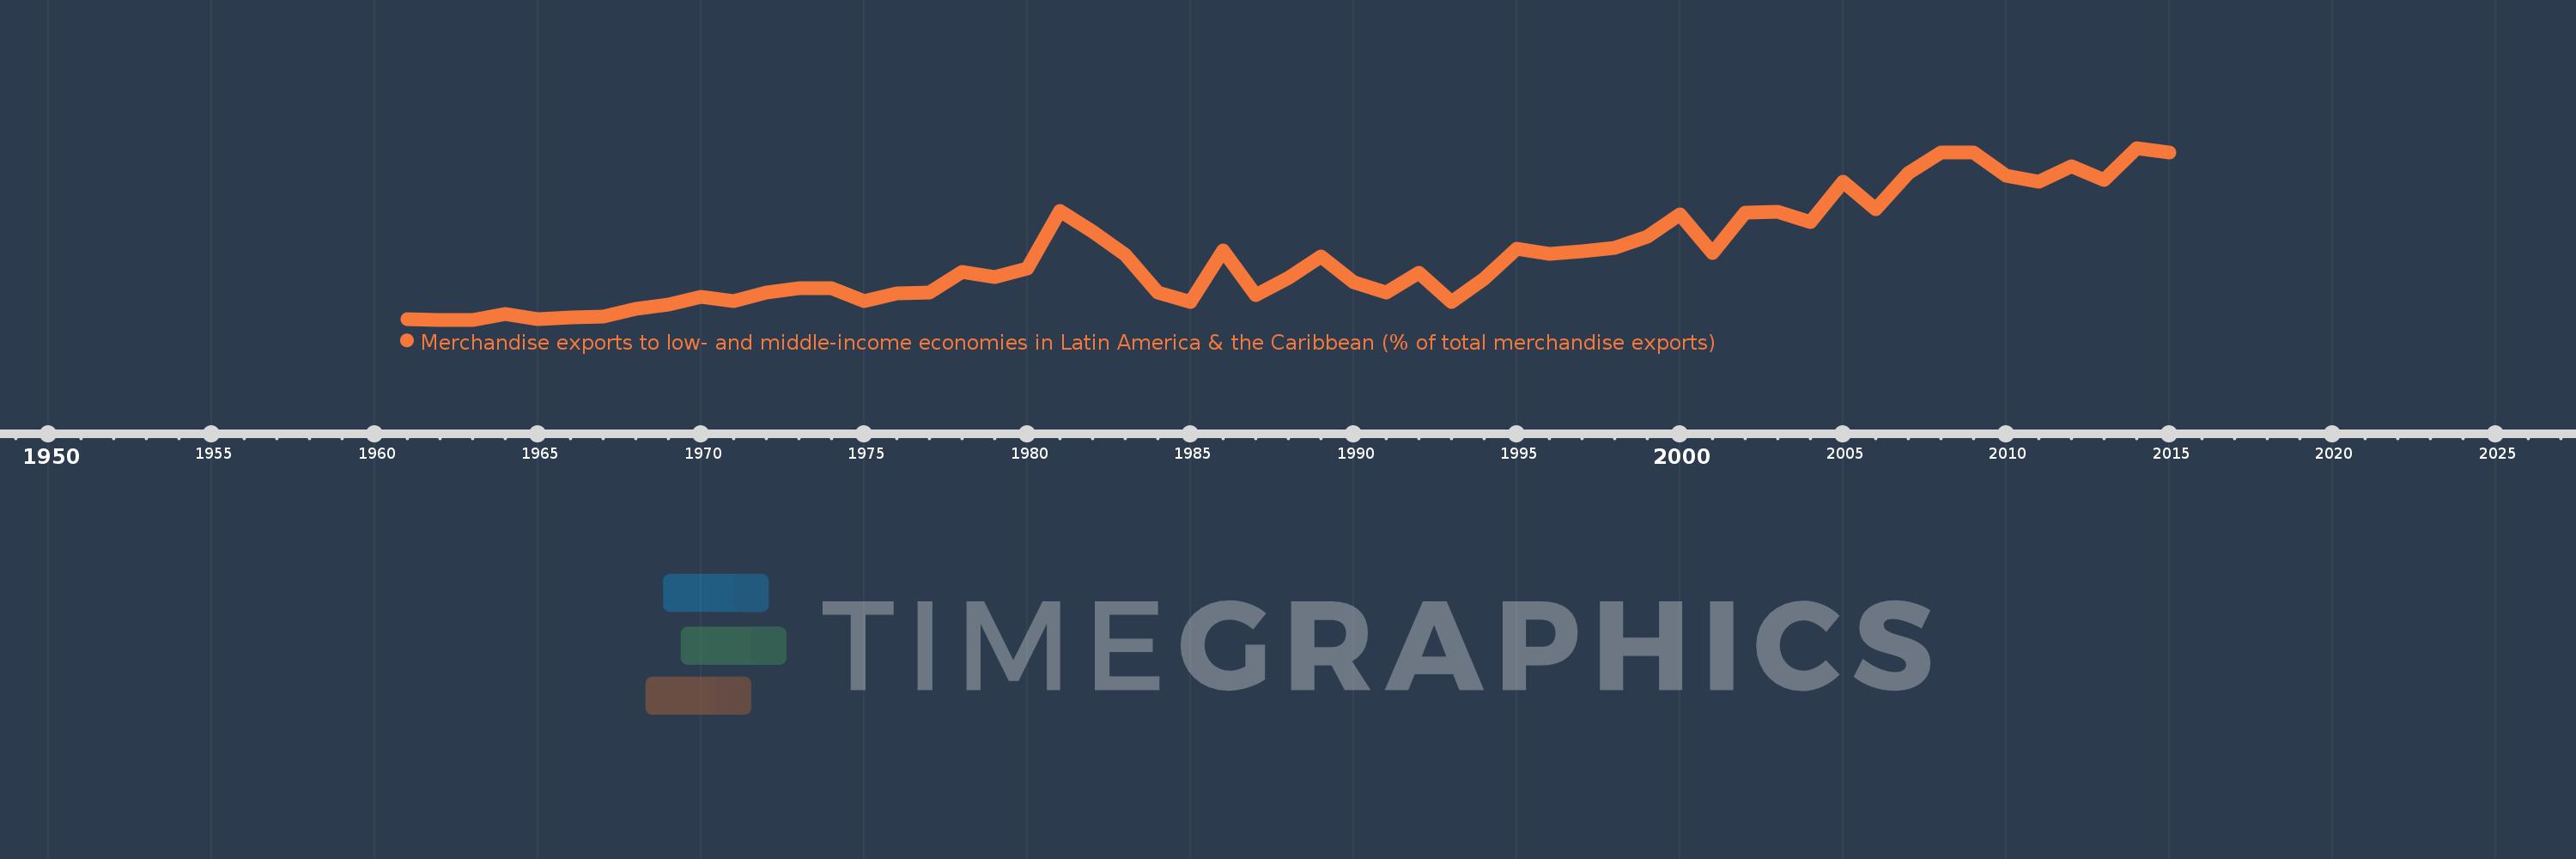
Merchandise exports to low- and middle-income economies in Latin America & the Caribbean (% of total merchandise exports)
2015,2014,2013,2012,2011,2010,2009,2008,2007,2006,2005,2004,2003,2002,2001,2000,1999,1998,1997,1996,1995,1994,1993,1992,1991,1990,1989,1988,1987,1986,1985,1984,1983,1982,1981,1980,1979,1978,1977,1976,1975,1974,1973,1972,1971,1970,1969,1968,1967,1966,1965,1964,1963,1962,1961
This statistics in other country:
AfghanistanAlbaniaAlgeriaAngolaAntigua and BarbudaArab WorldArgentinaArmeniaArubaAustraliaAustriaAzerbaijanBahamas, TheBahrainBangladeshBarbadosBelarusBelgiumBelizeBeninBermudaBoliviaBrazilBrunei DarussalamBulgariaBurundiCabo VerdeCambodiaCameroonCanadaCaribbean small statesCentral African RepublicCentral Europe and the BalticsChileChinaColombiaCongo, Dem. Rep.Congo, Rep.Costa RicaCote d'IvoireCroatiaCubaCyprusCzech RepublicDenmarkDominicaDominican RepublicEarly-demographic dividendEast Asia & PacificEast Asia & Pacific (excluding high income)East Asia & Pacific (IDA & IBRD countries)EcuadorEgypt, Arab Rep.El SalvadorEstoniaEthiopiaEuro areaEurope & Central AsiaEurope & Central Asia (excluding high income)Europe & Central Asia (IDA & IBRD countries)European UnionFaroe IslandsFijiFinlandFragile and conflict affected situationsFranceFrench PolynesiaGabonGambia, TheGeorgiaGermanyGhanaGibraltarGreeceGreenlandGrenadaGuatemalaGuineaGuyanaHaitiHeavily indebted poor countries (HIPC)High incomeHondurasHong Kong SAR, ChinaHungaryIBRD onlyIcelandIDA & IBRD totalIDA blendIDA onlyIDA totalIndiaIndonesiaIran, Islamic Rep.IraqIrelandIsraelItalyJamaicaJapanJordanKazakhstanKenyaKorea, Dem. People’s Rep.Korea, Rep.KuwaitLao PDRLate-demographic dividendLatin America & Caribbean Latin America & Caribbean (excluding high income)Latin America & the Caribbean (IDA & IBRD countries)LatviaLeast developed countries: UN classificationLebanonLiberiaLibyaLithuaniaLow & middle incomeLow incomeLower middle incomeLuxembourgMacao SAR, ChinaMacedonia, FYRMadagascarMalawiMalaysiaMaliMaltaMauritaniaMauritiusMexicoMiddle East & North AfricaMiddle East & North Africa (excluding high income)Middle East & North Africa (IDA & IBRD countries)Middle incomeMongoliaMontenegroMoroccoMozambiqueMyanmarNetherlandsNew CaledoniaNew ZealandNicaraguaNigerNigeriaNorth AmericaNorwayOECD membersOmanOther small statesPacific island small statesPakistanPanamaPapua New GuineaParaguayPeruPhilippinesPolandPortugalPost-demographic dividendPre-demographic dividendQatarRomaniaRussian FederationRwandaSamoaSaudi ArabiaSenegalSerbiaSierra LeoneSingaporeSlovak RepublicSloveniaSmall statesSomaliaSouth AfricaSouth AsiaSouth Asia (IDA & IBRD)SpainSri LankaSt. Kitts and NevisSt. LuciaSt. Vincent and the GrenadinesSub-Saharan Africa Sub-Saharan Africa (excluding high income)Sub-Saharan Africa (IDA & IBRD countries)SudanSurinameSwedenSwitzerlandSyrian Arab RepublicTanzaniaThailandTogoTrinidad and TobagoTunisiaTurkeyUgandaUkraineUnited Arab EmiratesUnited KingdomUnited StatesUpper middle incomeUruguayVenezuela, RBVietnamWorldYemen, Rep.ZambiaZimbabwe Timeline:
This timeline shows a graph from 1961 to 2015 of Sub-Saharan Africa (IDA & IBRD countries). No data until 1960. Number of actual observations by date: 55.
Source name:
World Development Indicators
Source organization:
World Bank staff estimates based data from International Monetary Fund's Direction of Trade database.
Categories, topics:
Private Sector, Trade
Last updated:
apr 23, 2017
Indicators value changes by year
At the date of observation
Value
Absolute change
Change from previous value
jan 1, 1961
0.071
+0.071
0.0%
jan 1, 1962
0.065
-0.006
-8.27%
jan 1, 1963
0.068
+0.003
4.05%
jan 1, 1964
0.185
+0.117
173.5%
jan 1, 1965
0.074
-0.111
-60.14%
jan 1, 1966
0.109
+0.035
47.45%
jan 1, 1967
0.127
+0.019
17.2%
jan 1, 1968
0.291
+0.164
128.38%
jan 1, 1969
0.38
+0.089
30.52%
jan 1, 1970
0.548
+0.168
44.17%
jan 1, 1971
0.45
-0.098
-17.87%
jan 1, 1972
0.636
+0.186
41.33%
jan 1, 1973
0.72
+0.084
13.2%
jan 1, 1974
0.717
-0.003
-0.38%
jan 1, 1975
0.448
-0.269
-37.5%
jan 1, 1976
0.619
+0.171
38.11%
jan 1, 1977
0.631
+0.012
1.92%
jan 1, 1978
1.066
+0.436
69.04%
jan 1, 1979
0.966
-0.1
-9.38%
jan 1, 1980
1.133
+0.167
17.24%
jan 1, 1981
2.342
+1.209
106.72%
jan 1, 1982
1.907
-0.435
-18.58%
jan 1, 1983
1.423
-0.483
-25.36%
jan 1, 1984
0.636
-0.787
-55.32%
jan 1, 1985
0.445
-0.191
-30.01%
jan 1, 1986
1.524
+1.079
242.36%
jan 1, 1987
0.573
-0.951
-62.42%
jan 1, 1988
0.942
+0.369
64.41%
jan 1, 1989
1.387
+0.446
47.33%
jan 1, 1990
0.844
-0.543
-39.13%
jan 1, 1991
0.642
-0.203
-24.01%
jan 1, 1992
1.05
+0.409
63.68%
jan 1, 1993
0.439
-0.611
-58.21%
jan 1, 1994
0.929
+0.49
111.63%
jan 1, 1995
1.552
+0.623
67.11%
jan 1, 1996
1.442
-0.11
-7.09%
jan 1, 1997
1.496
+0.054
3.76%
jan 1, 1998
1.563
+0.066
4.42%
jan 1, 1999
1.796
+0.234
14.96%
jan 1, 2000
2.267
+0.471
26.21%
jan 1, 2001
1.461
-0.806
-35.55%
jan 1, 2002
2.311
+0.849
58.1%
jan 1, 2003
2.321
+0.011
0.46%
jan 1, 2004
2.104
-0.217
-9.34%
jan 1, 2005
2.949
+0.845
40.14%
jan 1, 2006
2.381
-0.568
-19.28%
jan 1, 2007
3.127
+0.746
31.34%
jan 1, 2008
3.569
+0.442
14.13%
jan 1, 2009
3.564
-0.004
-0.12%
jan 1, 2010
3.076
-0.488
-13.7%
jan 1, 2011
2.947
-0.129
-4.19%
jan 1, 2012
3.284
+0.337
11.44%
jan 1, 2013
2.984
-0.301
-9.15%
jan 1, 2014
3.663
+0.679
22.77%
jan 1, 2015
3.576
-0.087
-2.38%
Ranking of countries by current statistics by years


Comments: