29
/
en
AIzaSyAYiBZKx7MnpbEhh9jyipgxe19OcubqV5w
April 1, 2024
30060
Euro area
EMU
false
2
1
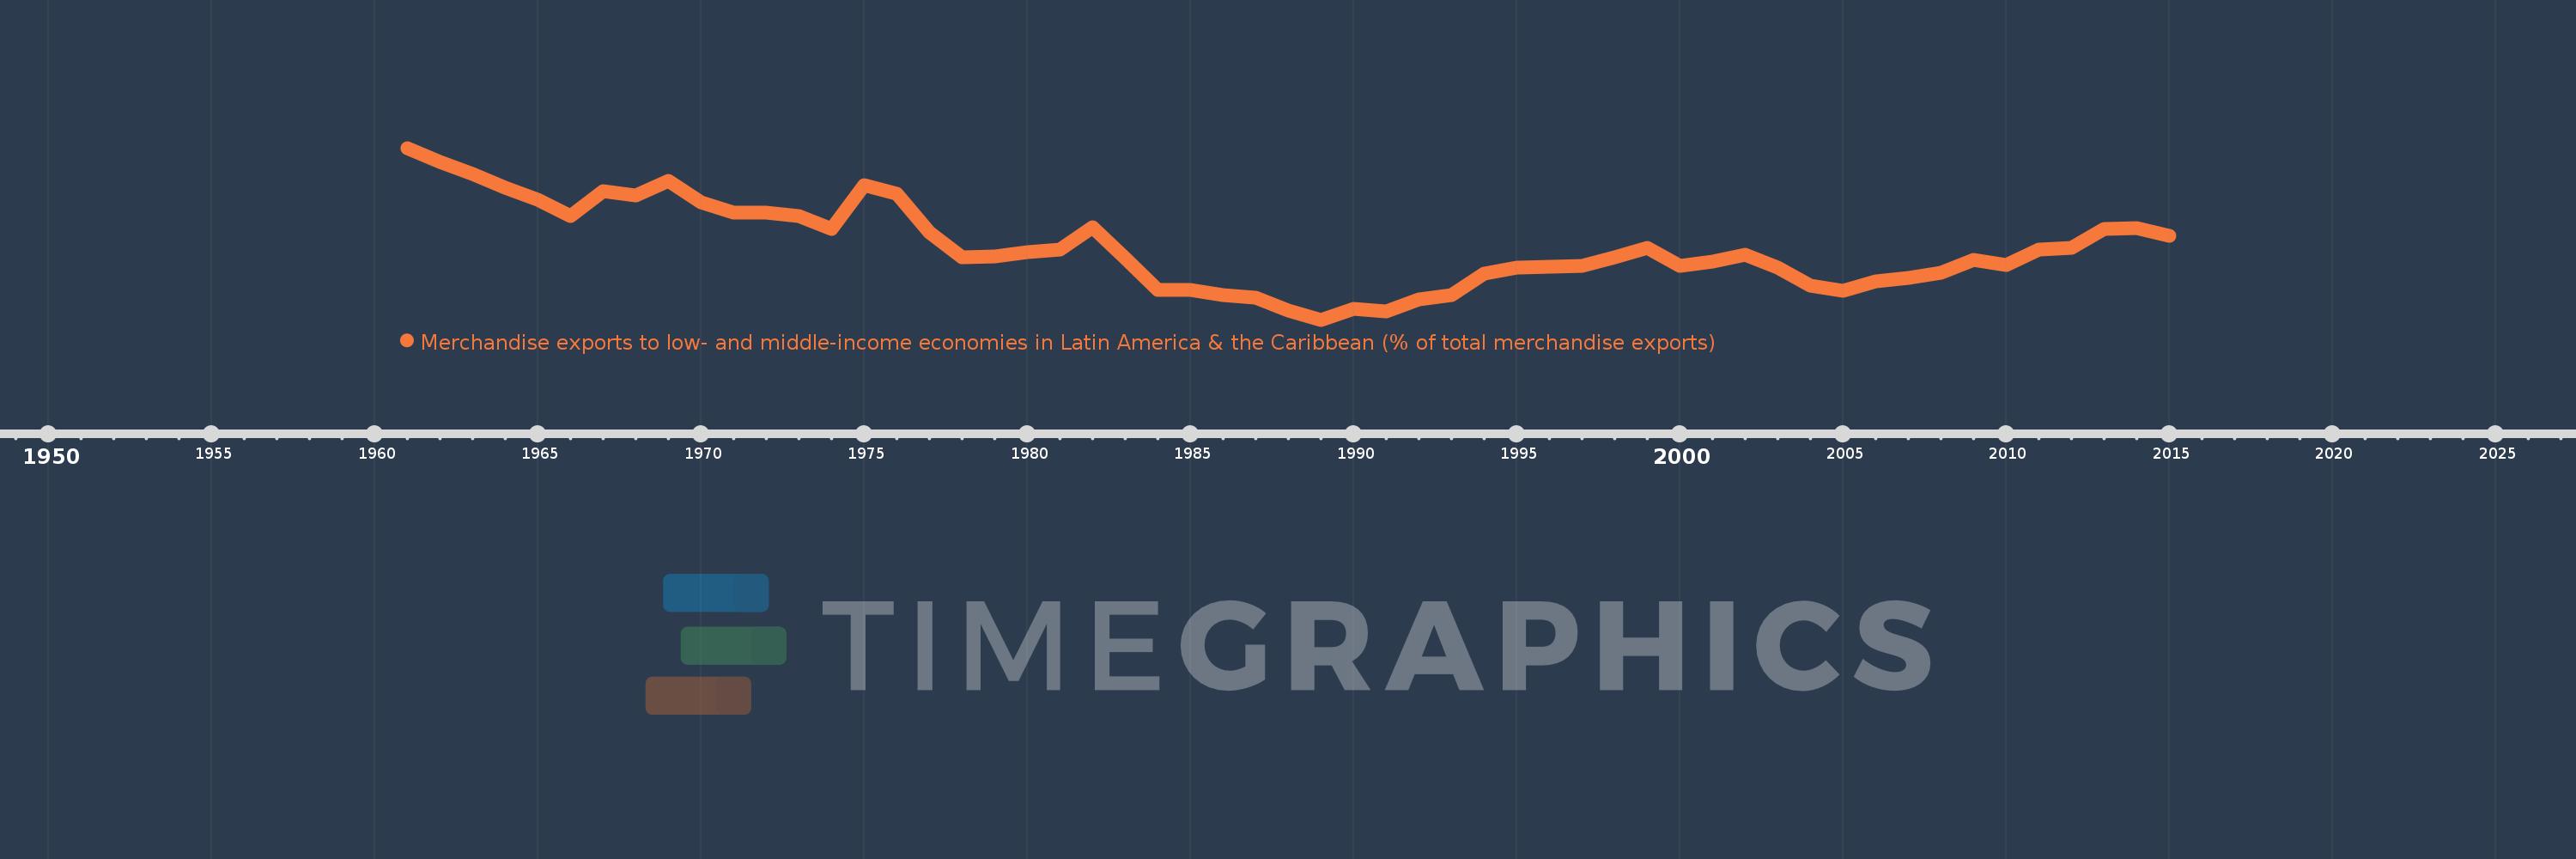
Merchandise exports to low- and middle-income economies in Latin America & the Caribbean (% of total merchandise exports)
2015,2014,2013,2012,2011,2010,2009,2008,2007,2006,2005,2004,2003,2002,2001,2000,1999,1998,1997,1996,1995,1994,1993,1992,1991,1990,1989,1988,1987,1986,1985,1984,1983,1982,1981,1980,1979,1978,1977,1976,1975,1974,1973,1972,1971,1970,1969,1968,1967,1966,1965,1964,1963,1962,1961
This statistics in other country:
AfghanistanAlbaniaAlgeriaAngolaAntigua and BarbudaArab WorldArgentinaArmeniaArubaAustraliaAustriaAzerbaijanBahamas, TheBahrainBangladeshBarbadosBelarusBelgiumBelizeBeninBermudaBoliviaBrazilBrunei DarussalamBulgariaBurundiCabo VerdeCambodiaCameroonCanadaCaribbean small statesCentral African RepublicCentral Europe and the BalticsChileChinaColombiaCongo, Dem. Rep.Congo, Rep.Costa RicaCote d'IvoireCroatiaCubaCyprusCzech RepublicDenmarkDominicaDominican RepublicEarly-demographic dividendEast Asia & PacificEast Asia & Pacific (excluding high income)East Asia & Pacific (IDA & IBRD countries)EcuadorEgypt, Arab Rep.El SalvadorEstoniaEthiopiaEuro areaEurope & Central AsiaEurope & Central Asia (excluding high income)Europe & Central Asia (IDA & IBRD countries)European UnionFaroe IslandsFijiFinlandFragile and conflict affected situationsFranceFrench PolynesiaGabonGambia, TheGeorgiaGermanyGhanaGibraltarGreeceGreenlandGrenadaGuatemalaGuineaGuyanaHaitiHeavily indebted poor countries (HIPC)High incomeHondurasHong Kong SAR, ChinaHungaryIBRD onlyIcelandIDA & IBRD totalIDA blendIDA onlyIDA totalIndiaIndonesiaIran, Islamic Rep.IraqIrelandIsraelItalyJamaicaJapanJordanKazakhstanKenyaKorea, Dem. People’s Rep.Korea, Rep.KuwaitLao PDRLate-demographic dividendLatin America & Caribbean Latin America & Caribbean (excluding high income)Latin America & the Caribbean (IDA & IBRD countries)LatviaLeast developed countries: UN classificationLebanonLiberiaLibyaLithuaniaLow & middle incomeLow incomeLower middle incomeLuxembourgMacao SAR, ChinaMacedonia, FYRMadagascarMalawiMalaysiaMaliMaltaMauritaniaMauritiusMexicoMiddle East & North AfricaMiddle East & North Africa (excluding high income)Middle East & North Africa (IDA & IBRD countries)Middle incomeMongoliaMontenegroMoroccoMozambiqueMyanmarNetherlandsNew CaledoniaNew ZealandNicaraguaNigerNigeriaNorth AmericaNorwayOECD membersOmanOther small statesPacific island small statesPakistanPanamaPapua New GuineaParaguayPeruPhilippinesPolandPortugalPost-demographic dividendPre-demographic dividendQatarRomaniaRussian FederationRwandaSamoaSaudi ArabiaSenegalSerbiaSierra LeoneSingaporeSlovak RepublicSloveniaSmall statesSomaliaSouth AfricaSouth AsiaSouth Asia (IDA & IBRD)SpainSri LankaSt. Kitts and NevisSt. LuciaSt. Vincent and the GrenadinesSub-Saharan Africa Sub-Saharan Africa (excluding high income)Sub-Saharan Africa (IDA & IBRD countries)SudanSurinameSwedenSwitzerlandSyrian Arab RepublicTanzaniaThailandTogoTrinidad and TobagoTunisiaTurkeyUgandaUkraineUnited Arab EmiratesUnited KingdomUnited StatesUpper middle incomeUruguayVenezuela, RBVietnamWorldYemen, Rep.ZambiaZimbabwe Timeline:
This timeline shows a graph from 1961 to 2015 of Euro area. No data until 1960. Number of actual observations by date: 55.
Source name:
World Development Indicators
Source organization:
World Bank staff estimates based data from International Monetary Fund's Direction of Trade database.
Categories, topics:
Private Sector, Trade
Last updated:
apr 23, 2017
Indicators value changes by year
At the date of observation
Value
Absolute change
Change from previous value
jan 1, 1961
3.025
+3.025
0.0%
jan 1, 1962
2.863
-0.162
-5.35%
jan 1, 1963
2.724
-0.139
-4.87%
jan 1, 1964
2.569
-0.155
-5.7%
jan 1, 1965
2.437
-0.131
-5.11%
jan 1, 1966
2.25
-0.187
-7.68%
jan 1, 1967
2.528
+0.278
12.35%
jan 1, 1968
2.484
-0.045
-1.76%
jan 1, 1969
2.651
+0.168
6.76%
jan 1, 1970
2.406
-0.246
-9.27%
jan 1, 1971
2.286
-0.12
-4.97%
jan 1, 1972
2.289
+0.002
0.11%
jan 1, 1973
2.243
-0.045
-1.98%
jan 1, 1974
2.101
-0.142
-6.32%
jan 1, 1975
2.605
+0.504
23.96%
jan 1, 1976
2.507
-0.098
-3.76%
jan 1, 1977
2.059
-0.448
-17.86%
jan 1, 1978
1.779
-0.28
-13.6%
jan 1, 1979
1.785
+0.006
0.31%
jan 1, 1980
1.833
+0.048
2.67%
jan 1, 1981
1.868
+0.035
1.92%
jan 1, 1982
2.118
+0.251
13.42%
jan 1, 1983
1.769
-0.349
-16.49%
jan 1, 1984
1.408
-0.361
-20.42%
jan 1, 1985
1.4
-0.007
-0.53%
jan 1, 1986
1.349
-0.051
-3.65%
jan 1, 1987
1.319
-0.031
-2.27%
jan 1, 1988
1.17
-0.148
-11.24%
jan 1, 1989
1.064
-0.106
-9.08%
jan 1, 1990
1.189
+0.125
11.74%
jan 1, 1991
1.157
-0.032
-2.67%
jan 1, 1992
1.298
+0.14
12.13%
jan 1, 1993
1.348
+0.05
3.88%
jan 1, 1994
1.591
+0.243
18.04%
jan 1, 1995
1.661
+0.069
4.35%
jan 1, 1996
1.666
+0.006
0.33%
jan 1, 1997
1.676
+0.009
0.57%
jan 1, 1998
1.772
+0.096
5.74%
jan 1, 1999
1.884
+0.112
6.33%
jan 1, 2000
1.682
-0.201
-10.69%
jan 1, 2001
1.728
+0.046
2.73%
jan 1, 2002
1.81
+0.082
4.75%
jan 1, 2003
1.664
-0.147
-8.11%
jan 1, 2004
1.449
-0.214
-12.88%
jan 1, 2005
1.394
-0.055
-3.81%
jan 1, 2006
1.501
+0.107
7.65%
jan 1, 2007
1.538
+0.037
2.46%
jan 1, 2008
1.599
+0.061
3.97%
jan 1, 2009
1.744
+0.145
9.08%
jan 1, 2010
1.692
-0.052
-3.0%
jan 1, 2011
1.869
+0.178
10.51%
jan 1, 2012
1.889
+0.019
1.03%
jan 1, 2013
2.097
+0.208
11.02%
jan 1, 2014
2.108
+0.011
0.52%
jan 1, 2015
2.021
-0.087
-4.11%
Ranking of countries by current statistics by years


Comments: