29
/
en
AIzaSyAYiBZKx7MnpbEhh9jyipgxe19OcubqV5w
April 1, 2024
69014
Antigua and Barbuda
ATG
true
2
1
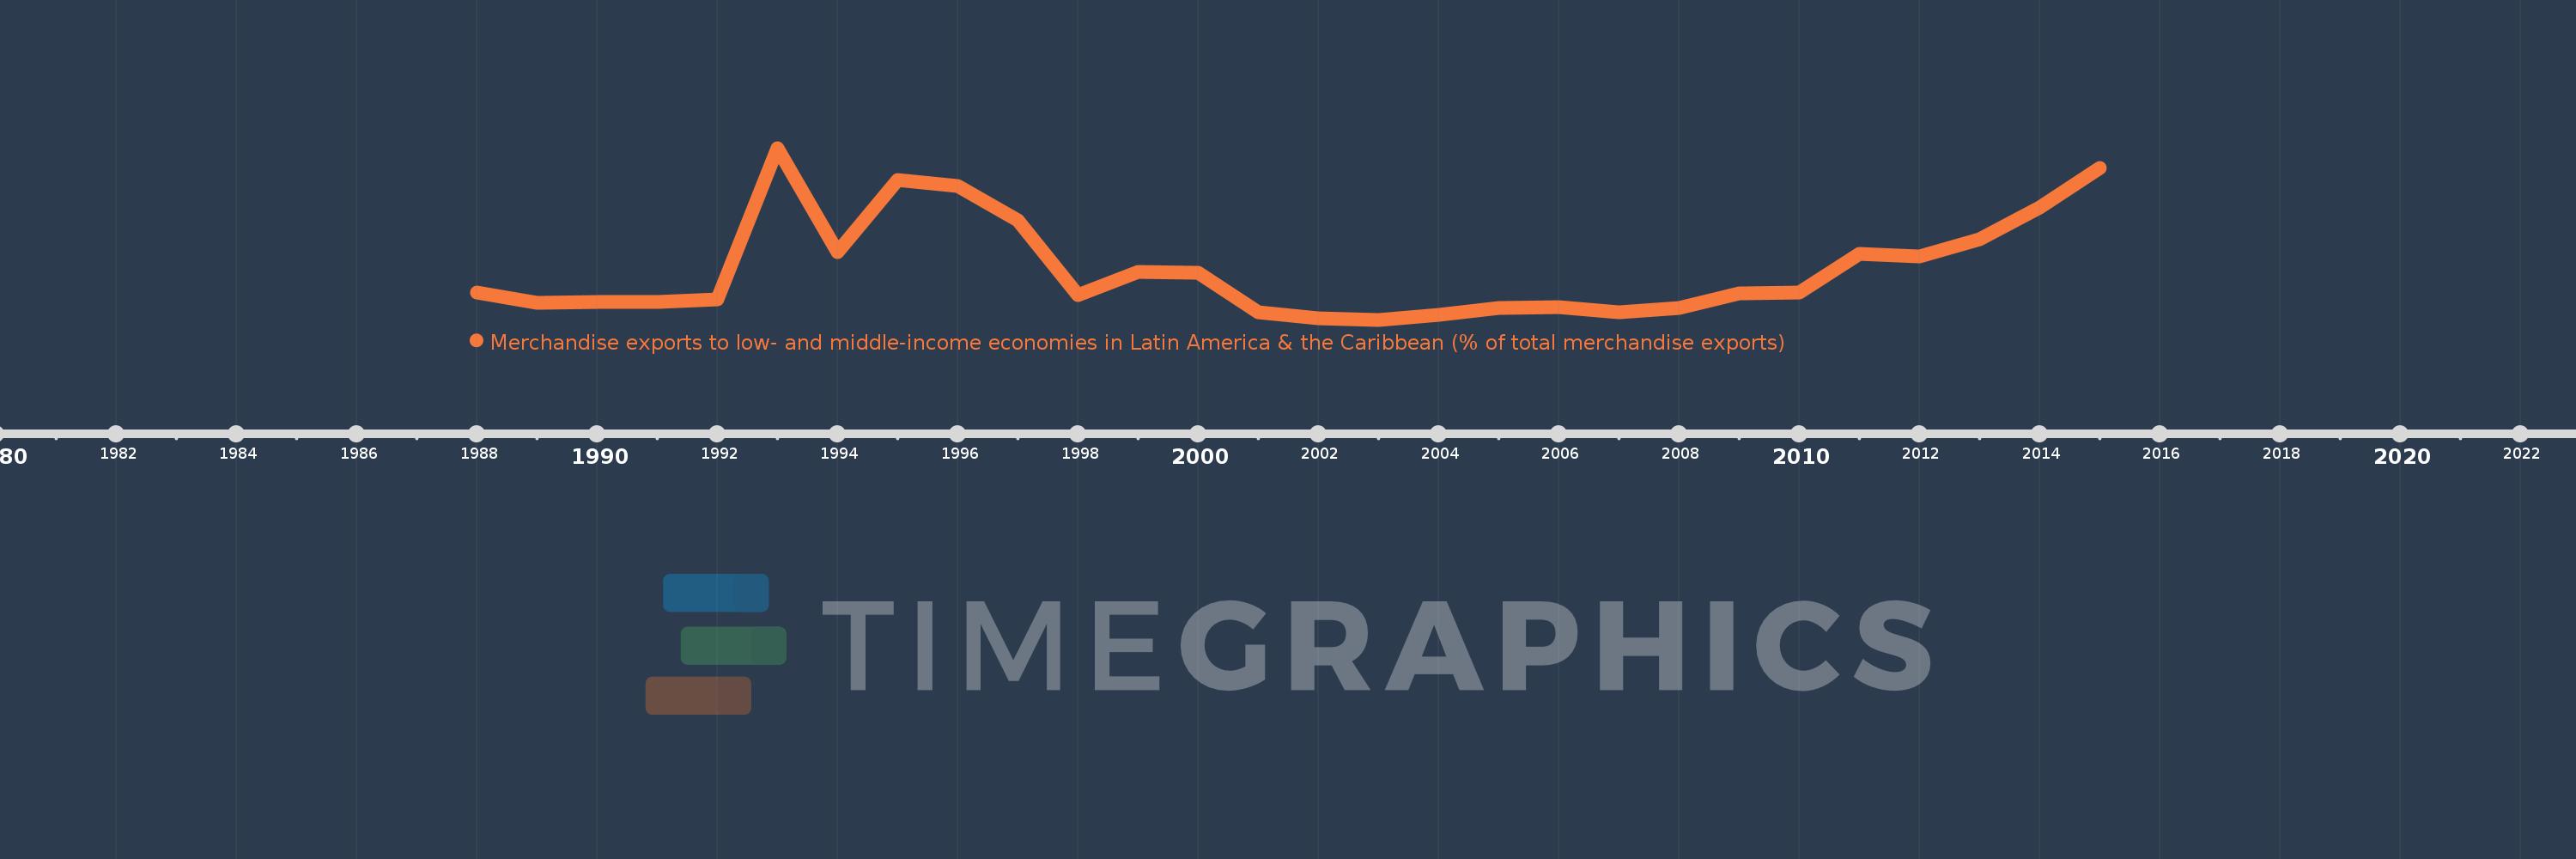
Merchandise exports to low- and middle-income economies in Latin America & the Caribbean (% of total merchandise exports)
2015,2014,2013,2012,2011,2010,2009,2008,2007,2006,2005,2004,2003,2002,2001,2000,1999,1998,1997,1996,1995,1994,1993,1992,1991,1990,1989,1988
This statistics in other country:
AfghanistanAlbaniaAlgeriaAngolaAntigua and BarbudaArab WorldArgentinaArmeniaArubaAustraliaAustriaAzerbaijanBahamas, TheBahrainBangladeshBarbadosBelarusBelgiumBelizeBeninBermudaBoliviaBrazilBrunei DarussalamBulgariaBurundiCabo VerdeCambodiaCameroonCanadaCaribbean small statesCentral African RepublicCentral Europe and the BalticsChileChinaColombiaCongo, Dem. Rep.Congo, Rep.Costa RicaCote d'IvoireCroatiaCubaCyprusCzech RepublicDenmarkDominicaDominican RepublicEarly-demographic dividendEast Asia & PacificEast Asia & Pacific (excluding high income)East Asia & Pacific (IDA & IBRD countries)EcuadorEgypt, Arab Rep.El SalvadorEstoniaEthiopiaEuro areaEurope & Central AsiaEurope & Central Asia (excluding high income)Europe & Central Asia (IDA & IBRD countries)European UnionFaroe IslandsFijiFinlandFragile and conflict affected situationsFranceFrench PolynesiaGabonGambia, TheGeorgiaGermanyGhanaGibraltarGreeceGreenlandGrenadaGuatemalaGuineaGuyanaHaitiHeavily indebted poor countries (HIPC)High incomeHondurasHong Kong SAR, ChinaHungaryIBRD onlyIcelandIDA & IBRD totalIDA blendIDA onlyIDA totalIndiaIndonesiaIran, Islamic Rep.IraqIrelandIsraelItalyJamaicaJapanJordanKazakhstanKenyaKorea, Dem. People’s Rep.Korea, Rep.KuwaitLao PDRLate-demographic dividendLatin America & Caribbean Latin America & Caribbean (excluding high income)Latin America & the Caribbean (IDA & IBRD countries)LatviaLeast developed countries: UN classificationLebanonLiberiaLibyaLithuaniaLow & middle incomeLow incomeLower middle incomeLuxembourgMacao SAR, ChinaMacedonia, FYRMadagascarMalawiMalaysiaMaliMaltaMauritaniaMauritiusMexicoMiddle East & North AfricaMiddle East & North Africa (excluding high income)Middle East & North Africa (IDA & IBRD countries)Middle incomeMongoliaMontenegroMoroccoMozambiqueMyanmarNetherlandsNew CaledoniaNew ZealandNicaraguaNigerNigeriaNorth AmericaNorwayOECD membersOmanOther small statesPacific island small statesPakistanPanamaPapua New GuineaParaguayPeruPhilippinesPolandPortugalPost-demographic dividendPre-demographic dividendQatarRomaniaRussian FederationRwandaSamoaSaudi ArabiaSenegalSerbiaSierra LeoneSingaporeSlovak RepublicSloveniaSmall statesSomaliaSouth AfricaSouth AsiaSouth Asia (IDA & IBRD)SpainSri LankaSt. Kitts and NevisSt. LuciaSt. Vincent and the GrenadinesSub-Saharan Africa Sub-Saharan Africa (excluding high income)Sub-Saharan Africa (IDA & IBRD countries)SudanSurinameSwedenSwitzerlandSyrian Arab RepublicTanzaniaThailandTogoTrinidad and TobagoTunisiaTurkeyUgandaUkraineUnited Arab EmiratesUnited KingdomUnited StatesUpper middle incomeUruguayVenezuela, RBVietnamWorldYemen, Rep.ZambiaZimbabwe Timeline:
This timeline shows a graph from 1988 to 2015 of Antigua and Barbuda. No data until 1987. Number of actual observations by date: 28.
Source name:
World Development Indicators
Source organization:
World Bank staff estimates based data from International Monetary Fund's Direction of Trade database.
Categories, topics:
Private Sector, Trade
Last updated:
apr 23, 2017
Indicators value changes by year
Maximum:
47.501
jan 1, 1993
At the date of observation
Value
Absolute change
Change from previous value
jan 1, 1988
8.036
+8.036
0.0%
jan 1, 1989
5.284
-2.751
-34.24%
jan 1, 1990
5.383
+0.099
1.87%
jan 1, 1991
5.511
+0.128
2.38%
jan 1, 1992
6.064
+0.552
10.02%
jan 1, 1993
47.501
+41.437
683.38%
jan 1, 1994
18.977
-28.524
-60.05%
jan 1, 1995
38.683
+19.706
103.84%
jan 1, 1996
37.129
-1.553
-4.02%
jan 1, 1997
27.669
-9.461
-25.48%
jan 1, 1998
7.289
-20.379
-73.65%
jan 1, 1999
13.56
+6.27
86.02%
jan 1, 2000
13.276
-0.284
-2.09%
jan 1, 2001
2.704
-10.572
-79.63%
jan 1, 2002
1.054
-1.65
-61.01%
jan 1, 2003
0.55
-0.504
-47.8%
jan 1, 2004
1.948
+1.397
253.94%
jan 1, 2005
3.698
+1.75
89.88%
jan 1, 2006
4.005
+0.307
8.29%
jan 1, 2007
2.609
-1.396
-34.86%
jan 1, 2008
3.818
+1.21
46.37%
jan 1, 2009
7.786
+3.968
103.92%
jan 1, 2010
7.904
+0.117
1.51%
jan 1, 2011
18.523
+10.62
134.36%
jan 1, 2012
17.813
-0.71
-3.83%
jan 1, 2013
22.594
+4.781
26.84%
jan 1, 2014
31.321
+8.727
38.63%
jan 1, 2015
41.996
+10.675
34.08%
Ranking of countries by current statistics by years


Comments: