29
/
en
AIzaSyAYiBZKx7MnpbEhh9jyipgxe19OcubqV5w
April 1, 2024
245879
South Africa
ZAF
true
2
1
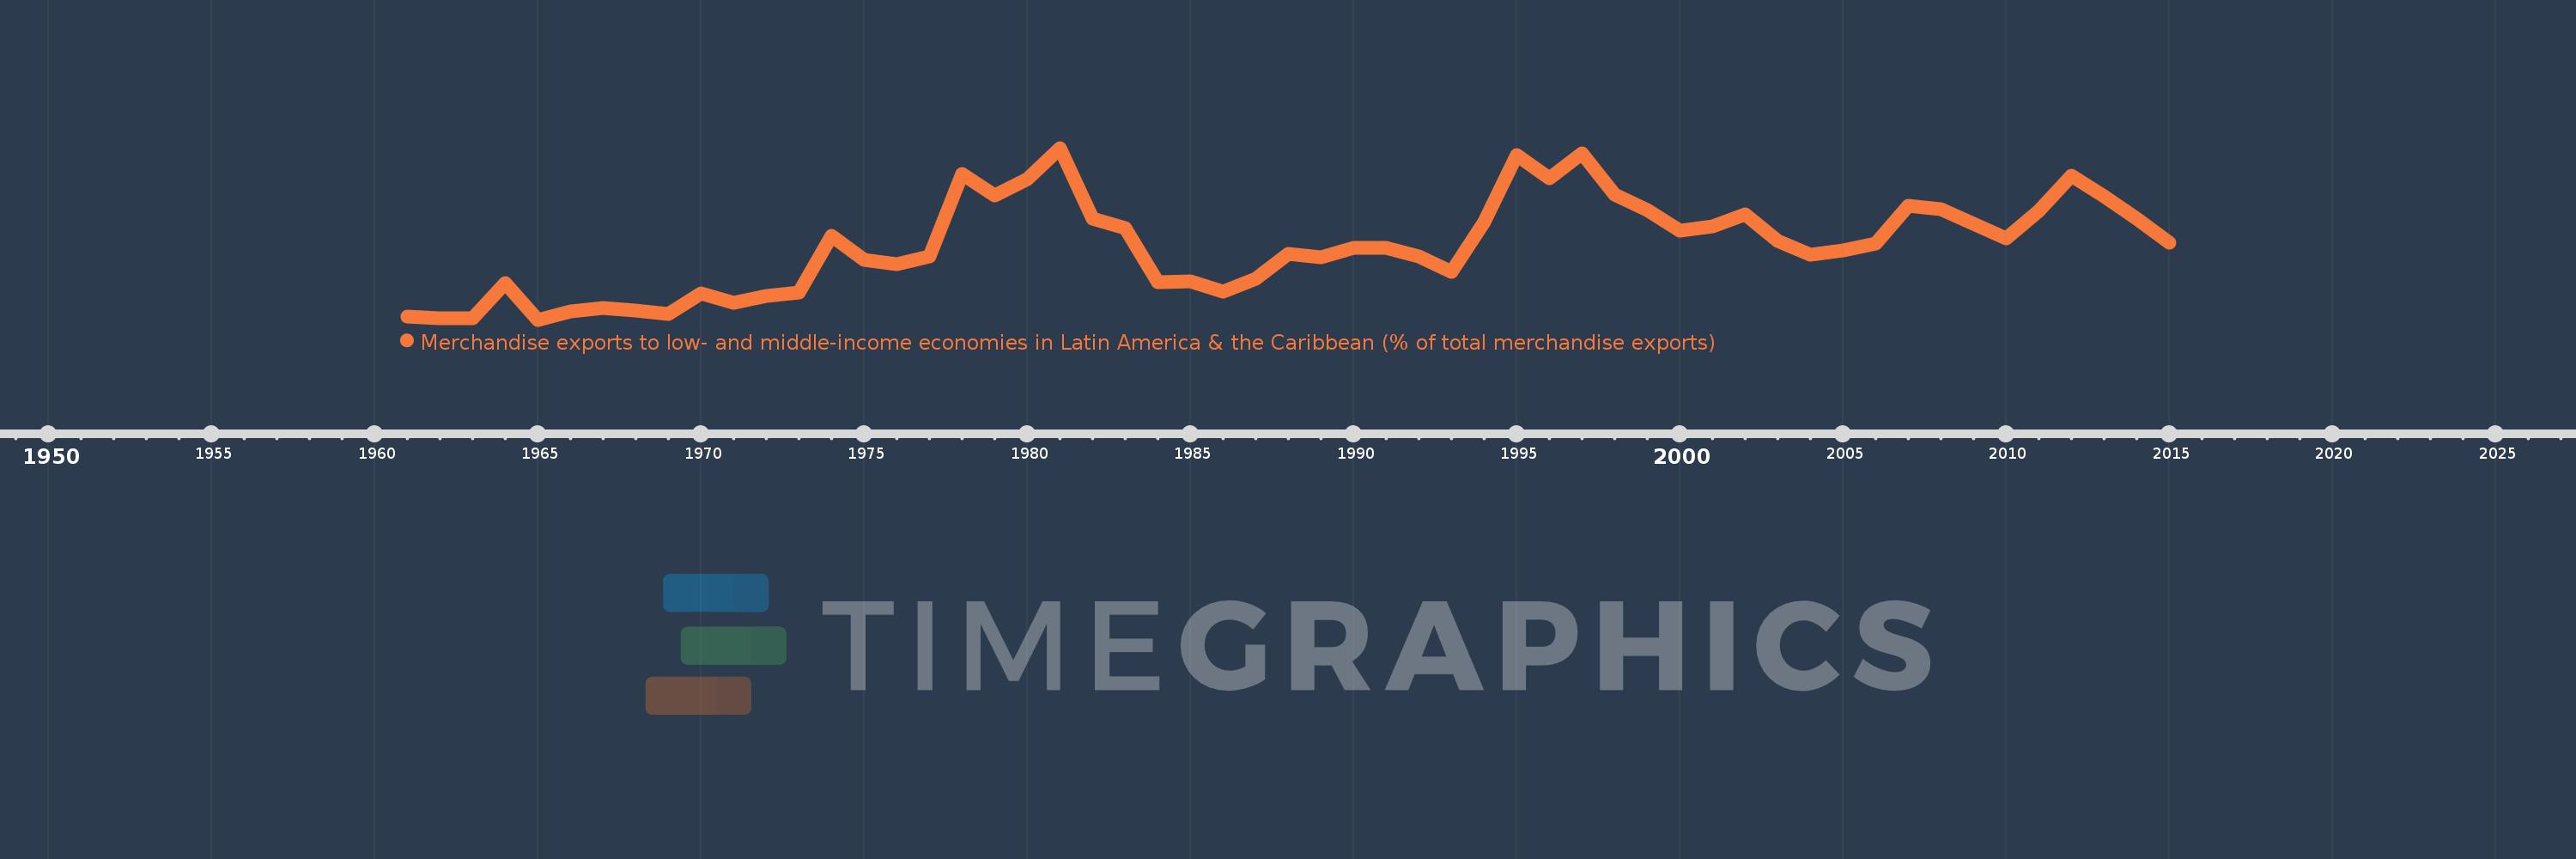
Merchandise exports to low- and middle-income economies in Latin America & the Caribbean (% of total merchandise exports)
2015,2014,2013,2012,2011,2010,2009,2008,2007,2006,2005,2004,2003,2002,2001,2000,1999,1998,1997,1996,1995,1994,1993,1992,1991,1990,1989,1988,1987,1986,1985,1984,1983,1982,1981,1980,1979,1978,1977,1976,1975,1974,1973,1972,1971,1970,1969,1968,1967,1966,1965,1964,1963,1962,1961
This statistics in other country:
AfghanistanAlbaniaAlgeriaAngolaAntigua and BarbudaArab WorldArgentinaArmeniaArubaAustraliaAustriaAzerbaijanBahamas, TheBahrainBangladeshBarbadosBelarusBelgiumBelizeBeninBermudaBoliviaBrazilBrunei DarussalamBulgariaBurundiCabo VerdeCambodiaCameroonCanadaCaribbean small statesCentral African RepublicCentral Europe and the BalticsChileChinaColombiaCongo, Dem. Rep.Congo, Rep.Costa RicaCote d'IvoireCroatiaCubaCyprusCzech RepublicDenmarkDominicaDominican RepublicEarly-demographic dividendEast Asia & PacificEast Asia & Pacific (excluding high income)East Asia & Pacific (IDA & IBRD countries)EcuadorEgypt, Arab Rep.El SalvadorEstoniaEthiopiaEuro areaEurope & Central AsiaEurope & Central Asia (excluding high income)Europe & Central Asia (IDA & IBRD countries)European UnionFaroe IslandsFijiFinlandFragile and conflict affected situationsFranceFrench PolynesiaGabonGambia, TheGeorgiaGermanyGhanaGibraltarGreeceGreenlandGrenadaGuatemalaGuineaGuyanaHaitiHeavily indebted poor countries (HIPC)High incomeHondurasHong Kong SAR, ChinaHungaryIBRD onlyIcelandIDA & IBRD totalIDA blendIDA onlyIDA totalIndiaIndonesiaIran, Islamic Rep.IraqIrelandIsraelItalyJamaicaJapanJordanKazakhstanKenyaKorea, Dem. People’s Rep.Korea, Rep.KuwaitLao PDRLate-demographic dividendLatin America & Caribbean Latin America & Caribbean (excluding high income)Latin America & the Caribbean (IDA & IBRD countries)LatviaLeast developed countries: UN classificationLebanonLiberiaLibyaLithuaniaLow & middle incomeLow incomeLower middle incomeLuxembourgMacao SAR, ChinaMacedonia, FYRMadagascarMalawiMalaysiaMaliMaltaMauritaniaMauritiusMexicoMiddle East & North AfricaMiddle East & North Africa (excluding high income)Middle East & North Africa (IDA & IBRD countries)Middle incomeMongoliaMontenegroMoroccoMozambiqueMyanmarNetherlandsNew CaledoniaNew ZealandNicaraguaNigerNigeriaNorth AmericaNorwayOECD membersOmanOther small statesPacific island small statesPakistanPanamaPapua New GuineaParaguayPeruPhilippinesPolandPortugalPost-demographic dividendPre-demographic dividendQatarRomaniaRussian FederationRwandaSamoaSaudi ArabiaSenegalSerbiaSierra LeoneSingaporeSlovak RepublicSloveniaSmall statesSomaliaSouth AfricaSouth AsiaSouth Asia (IDA & IBRD)SpainSri LankaSt. Kitts and NevisSt. LuciaSt. Vincent and the GrenadinesSub-Saharan Africa Sub-Saharan Africa (excluding high income)Sub-Saharan Africa (IDA & IBRD countries)SudanSurinameSwedenSwitzerlandSyrian Arab RepublicTanzaniaThailandTogoTrinidad and TobagoTunisiaTurkeyUgandaUkraineUnited Arab EmiratesUnited KingdomUnited StatesUpper middle incomeUruguayVenezuela, RBVietnamWorldYemen, Rep.ZambiaZimbabwe Timeline:
This timeline shows a graph from 1961 to 2015 of South Africa. No data until 1960. Number of actual observations by date: 55.
Source name:
World Development Indicators
Source organization:
World Bank staff estimates based data from International Monetary Fund's Direction of Trade database.
Categories, topics:
Private Sector, Trade
Last updated:
apr 23, 2017
Indicators value changes by year
At the date of observation
Value
Absolute change
Change from previous value
jan 1, 1961
0.21
+0.21
0.0%
jan 1, 1962
0.189
-0.021
-9.92%
jan 1, 1963
0.193
+0.004
2.07%
jan 1, 1964
0.601
+0.408
211.94%
jan 1, 1965
0.173
-0.428
-71.24%
jan 1, 1966
0.268
+0.095
54.79%
jan 1, 1967
0.308
+0.04
15.09%
jan 1, 1968
0.282
-0.026
-8.58%
jan 1, 1969
0.237
-0.045
-15.97%
jan 1, 1970
0.479
+0.242
102.38%
jan 1, 1971
0.368
-0.111
-23.23%
jan 1, 1972
0.449
+0.082
22.19%
jan 1, 1973
0.491
+0.042
9.24%
jan 1, 1974
1.159
+0.669
136.29%
jan 1, 1975
0.881
-0.278
-24.01%
jan 1, 1976
0.827
-0.054
-6.15%
jan 1, 1977
0.917
+0.09
10.94%
jan 1, 1978
1.886
+0.968
105.56%
jan 1, 1979
1.631
-0.255
-13.51%
jan 1, 1980
1.83
+0.199
12.21%
jan 1, 1981
2.195
+0.365
19.97%
jan 1, 1982
1.361
-0.834
-37.99%
jan 1, 1983
1.25
-0.111
-8.15%
jan 1, 1984
0.614
-0.636
-50.9%
jan 1, 1985
0.622
+0.008
1.36%
jan 1, 1986
0.508
-0.114
-18.4%
jan 1, 1987
0.658
+0.15
29.48%
jan 1, 1988
0.949
+0.292
44.34%
jan 1, 1989
0.911
-0.038
-4.03%
jan 1, 1990
1.023
+0.112
12.28%
jan 1, 1991
1.023
+0.0
0.04%
jan 1, 1992
0.915
-0.108
-10.59%
jan 1, 1993
0.74
-0.175
-19.07%
jan 1, 1994
1.318
+0.577
77.96%
jan 1, 1995
2.115
+0.797
60.53%
jan 1, 1996
1.834
-0.281
-13.29%
jan 1, 1997
2.136
+0.302
16.47%
jan 1, 1998
1.644
-0.492
-23.05%
jan 1, 1999
1.464
-0.18
-10.95%
jan 1, 2000
1.226
-0.238
-16.24%
jan 1, 2001
1.277
+0.051
4.15%
jan 1, 2002
1.409
+0.132
10.36%
jan 1, 2003
1.096
-0.314
-22.25%
jan 1, 2004
0.934
-0.162
-14.79%
jan 1, 2005
0.993
+0.059
6.3%
jan 1, 2006
1.066
+0.073
7.38%
jan 1, 2007
1.517
+0.451
42.33%
jan 1, 2008
1.47
-0.047
-3.1%
jan 1, 2009
1.301
-0.169
-11.51%
jan 1, 2010
1.131
-0.17
-13.05%
jan 1, 2011
1.452
+0.321
28.41%
jan 1, 2012
1.871
+0.418
28.81%
jan 1, 2013
1.63
-0.241
-12.88%
jan 1, 2014
1.359
-0.27
-16.59%
jan 1, 2015
1.075
-0.285
-20.95%
Ranking of countries by current statistics by years


Comments: