29
/
en
AIzaSyAYiBZKx7MnpbEhh9jyipgxe19OcubqV5w
April 1, 2024
25082
Caribbean small states
CSS
false
2
1
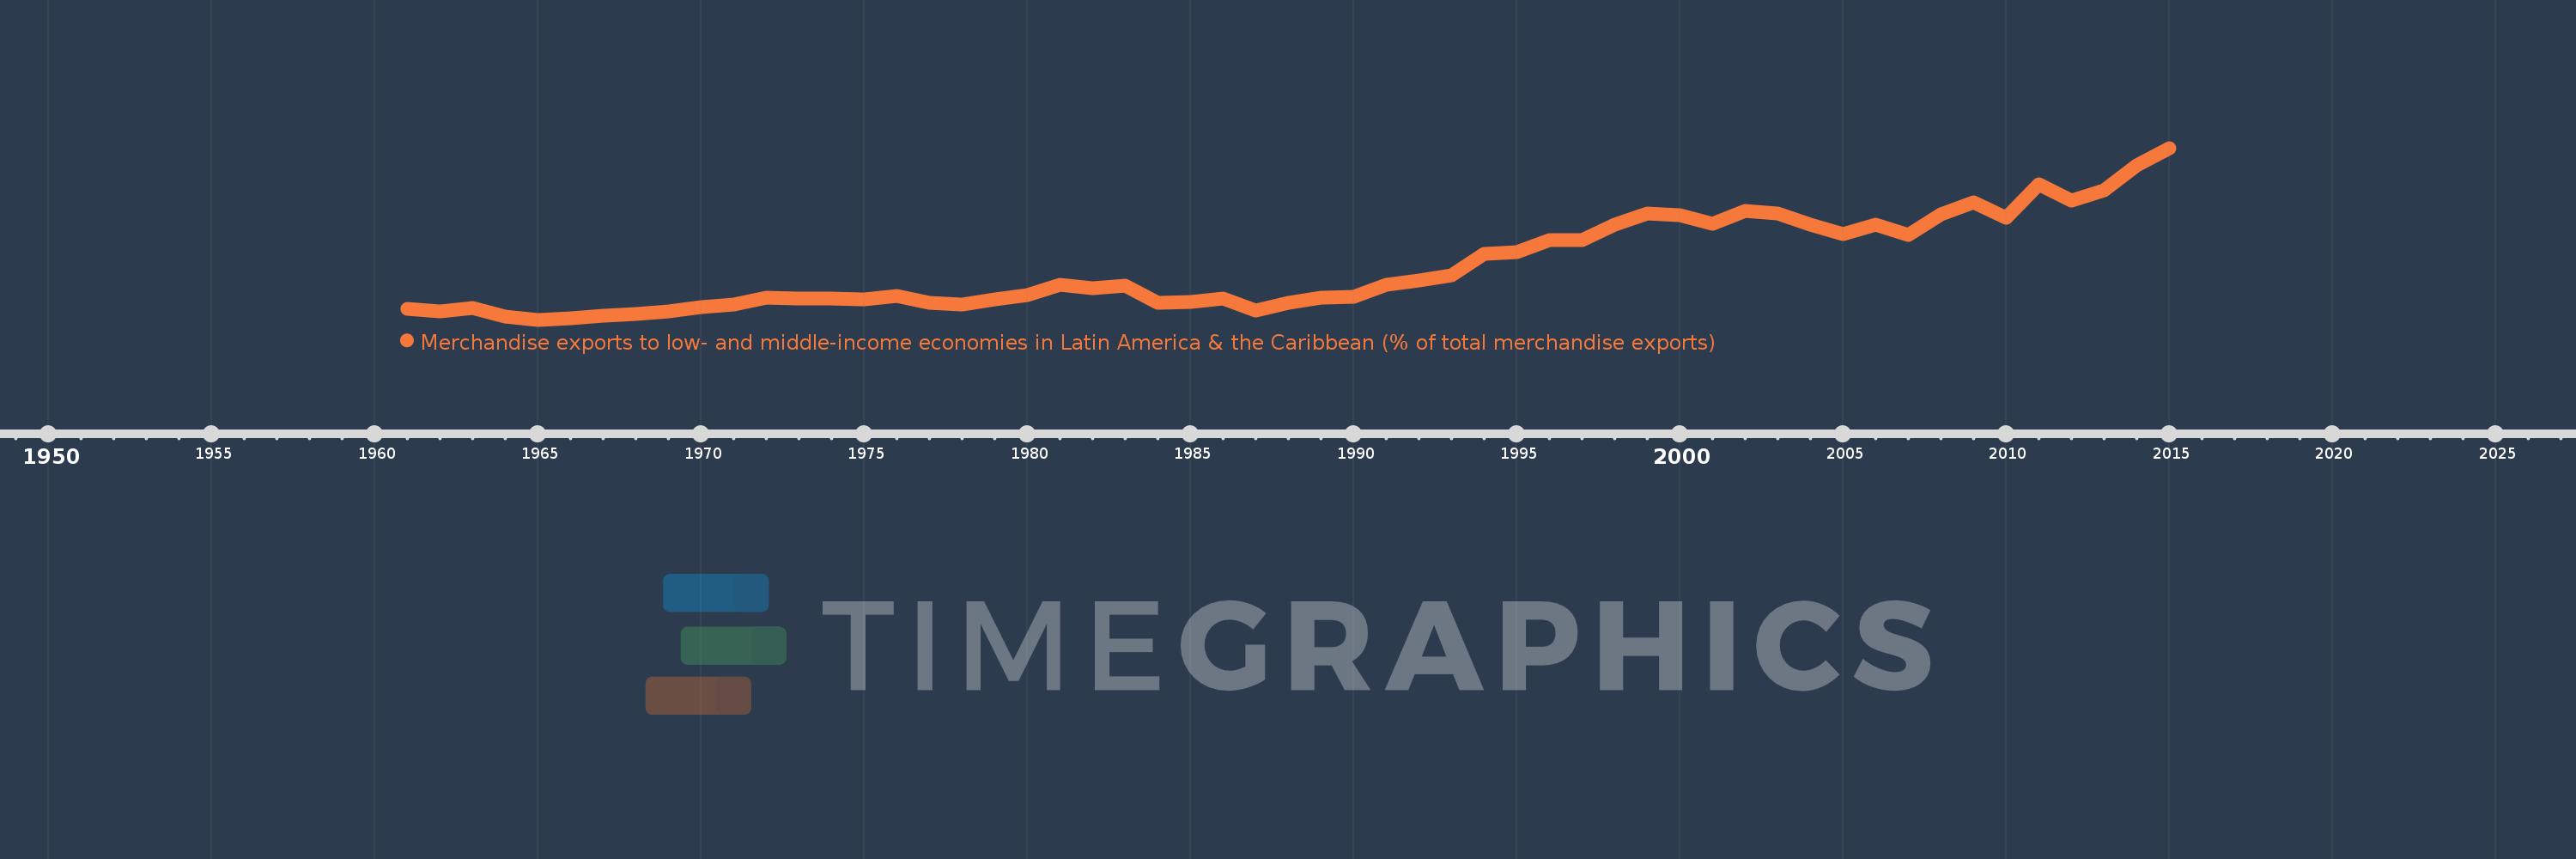
Merchandise exports to low- and middle-income economies in Latin America & the Caribbean (% of total merchandise exports)
2015,2014,2013,2012,2011,2010,2009,2008,2007,2006,2005,2004,2003,2002,2001,2000,1999,1998,1997,1996,1995,1994,1993,1992,1991,1990,1989,1988,1987,1986,1985,1984,1983,1982,1981,1980,1979,1978,1977,1976,1975,1974,1973,1972,1971,1970,1969,1968,1967,1966,1965,1964,1963,1962,1961
This statistics in other country:
AfghanistanAlbaniaAlgeriaAngolaAntigua and BarbudaArab WorldArgentinaArmeniaArubaAustraliaAustriaAzerbaijanBahamas, TheBahrainBangladeshBarbadosBelarusBelgiumBelizeBeninBermudaBoliviaBrazilBrunei DarussalamBulgariaBurundiCabo VerdeCambodiaCameroonCanadaCaribbean small statesCentral African RepublicCentral Europe and the BalticsChileChinaColombiaCongo, Dem. Rep.Congo, Rep.Costa RicaCote d'IvoireCroatiaCubaCyprusCzech RepublicDenmarkDominicaDominican RepublicEarly-demographic dividendEast Asia & PacificEast Asia & Pacific (excluding high income)East Asia & Pacific (IDA & IBRD countries)EcuadorEgypt, Arab Rep.El SalvadorEstoniaEthiopiaEuro areaEurope & Central AsiaEurope & Central Asia (excluding high income)Europe & Central Asia (IDA & IBRD countries)European UnionFaroe IslandsFijiFinlandFragile and conflict affected situationsFranceFrench PolynesiaGabonGambia, TheGeorgiaGermanyGhanaGibraltarGreeceGreenlandGrenadaGuatemalaGuineaGuyanaHaitiHeavily indebted poor countries (HIPC)High incomeHondurasHong Kong SAR, ChinaHungaryIBRD onlyIcelandIDA & IBRD totalIDA blendIDA onlyIDA totalIndiaIndonesiaIran, Islamic Rep.IraqIrelandIsraelItalyJamaicaJapanJordanKazakhstanKenyaKorea, Dem. People’s Rep.Korea, Rep.KuwaitLao PDRLate-demographic dividendLatin America & Caribbean Latin America & Caribbean (excluding high income)Latin America & the Caribbean (IDA & IBRD countries)LatviaLeast developed countries: UN classificationLebanonLiberiaLibyaLithuaniaLow & middle incomeLow incomeLower middle incomeLuxembourgMacao SAR, ChinaMacedonia, FYRMadagascarMalawiMalaysiaMaliMaltaMauritaniaMauritiusMexicoMiddle East & North AfricaMiddle East & North Africa (excluding high income)Middle East & North Africa (IDA & IBRD countries)Middle incomeMongoliaMontenegroMoroccoMozambiqueMyanmarNetherlandsNew CaledoniaNew ZealandNicaraguaNigerNigeriaNorth AmericaNorwayOECD membersOmanOther small statesPacific island small statesPakistanPanamaPapua New GuineaParaguayPeruPhilippinesPolandPortugalPost-demographic dividendPre-demographic dividendQatarRomaniaRussian FederationRwandaSamoaSaudi ArabiaSenegalSerbiaSierra LeoneSingaporeSlovak RepublicSloveniaSmall statesSomaliaSouth AfricaSouth AsiaSouth Asia (IDA & IBRD)SpainSri LankaSt. Kitts and NevisSt. LuciaSt. Vincent and the GrenadinesSub-Saharan Africa Sub-Saharan Africa (excluding high income)Sub-Saharan Africa (IDA & IBRD countries)SudanSurinameSwedenSwitzerlandSyrian Arab RepublicTanzaniaThailandTogoTrinidad and TobagoTunisiaTurkeyUgandaUkraineUnited Arab EmiratesUnited KingdomUnited StatesUpper middle incomeUruguayVenezuela, RBVietnamWorldYemen, Rep.ZambiaZimbabwe Timeline:
This timeline shows a graph from 1961 to 2015 of Caribbean small states. No data until 1960. Number of actual observations by date: 55.
Source name:
World Development Indicators
Source organization:
World Bank staff estimates based data from International Monetary Fund's Direction of Trade database.
Categories, topics:
Private Sector, Trade
Last updated:
apr 23, 2017
Indicators value changes by year
Maximum:
26.264
jan 1, 2015
At the date of observation
Value
Absolute change
Change from previous value
jan 1, 1961
3.99
+3.99
0.0%
jan 1, 1962
3.62
-0.37
-9.28%
jan 1, 1963
4.025
+0.405
11.19%
jan 1, 1964
2.852
-1.173
-29.15%
jan 1, 1965
2.448
-0.404
-14.16%
jan 1, 1966
2.709
+0.261
10.64%
jan 1, 1967
3.067
+0.359
13.24%
jan 1, 1968
3.242
+0.175
5.69%
jan 1, 1969
3.646
+0.404
12.47%
jan 1, 1970
4.23
+0.584
16.01%
jan 1, 1971
4.543
+0.313
7.4%
jan 1, 1972
5.51
+0.967
21.29%
jan 1, 1973
5.423
-0.086
-1.56%
jan 1, 1974
5.344
-0.08
-1.47%
jan 1, 1975
5.274
-0.07
-1.31%
jan 1, 1976
5.729
+0.455
8.64%
jan 1, 1977
4.739
-0.99
-17.29%
jan 1, 1978
4.503
-0.236
-4.98%
jan 1, 1979
5.271
+0.768
17.06%
jan 1, 1980
5.821
+0.55
10.44%
jan 1, 1981
7.326
+1.505
25.85%
jan 1, 1982
6.862
-0.464
-6.34%
jan 1, 1983
7.216
+0.354
5.16%
jan 1, 1984
4.852
-2.364
-32.76%
jan 1, 1985
4.902
+0.05
1.03%
jan 1, 1986
5.331
+0.43
8.76%
jan 1, 1987
3.671
-1.66
-31.14%
jan 1, 1988
4.842
+1.17
31.87%
jan 1, 1989
5.552
+0.71
14.67%
jan 1, 1990
5.685
+0.133
2.4%
jan 1, 1991
7.346
+1.661
29.23%
jan 1, 1992
7.925
+0.579
7.88%
jan 1, 1993
8.659
+0.734
9.26%
jan 1, 1994
11.639
+2.981
34.43%
jan 1, 1995
11.772
+0.133
1.14%
jan 1, 1996
13.478
+1.707
14.5%
jan 1, 1997
13.439
-0.04
-0.3%
jan 1, 1998
15.626
+2.187
16.28%
jan 1, 1999
17.219
+1.593
10.2%
jan 1, 2000
16.971
-0.248
-1.44%
jan 1, 2001
15.764
-1.206
-7.11%
jan 1, 2002
17.537
+1.773
11.25%
jan 1, 2003
17.126
-0.412
-2.35%
jan 1, 2004
15.661
-1.465
-8.55%
jan 1, 2005
14.331
-1.33
-8.49%
jan 1, 2006
15.657
+1.326
9.25%
jan 1, 2007
14.154
-1.502
-9.6%
jan 1, 2008
17.088
+2.934
20.73%
jan 1, 2009
18.757
+1.669
9.77%
jan 1, 2010
16.57
-2.187
-11.66%
jan 1, 2011
21.211
+4.641
28.01%
jan 1, 2012
18.925
-2.287
-10.78%
jan 1, 2013
20.343
+1.418
7.5%
jan 1, 2014
23.846
+3.503
17.22%
jan 1, 2015
26.264
+2.418
10.14%
Ranking of countries by current statistics by years


Comments: