29
/
en
AIzaSyAYiBZKx7MnpbEhh9jyipgxe19OcubqV5w
April 1, 2024
28331
East Asia & Pacific (excluding high income)
EAP
false
2
1
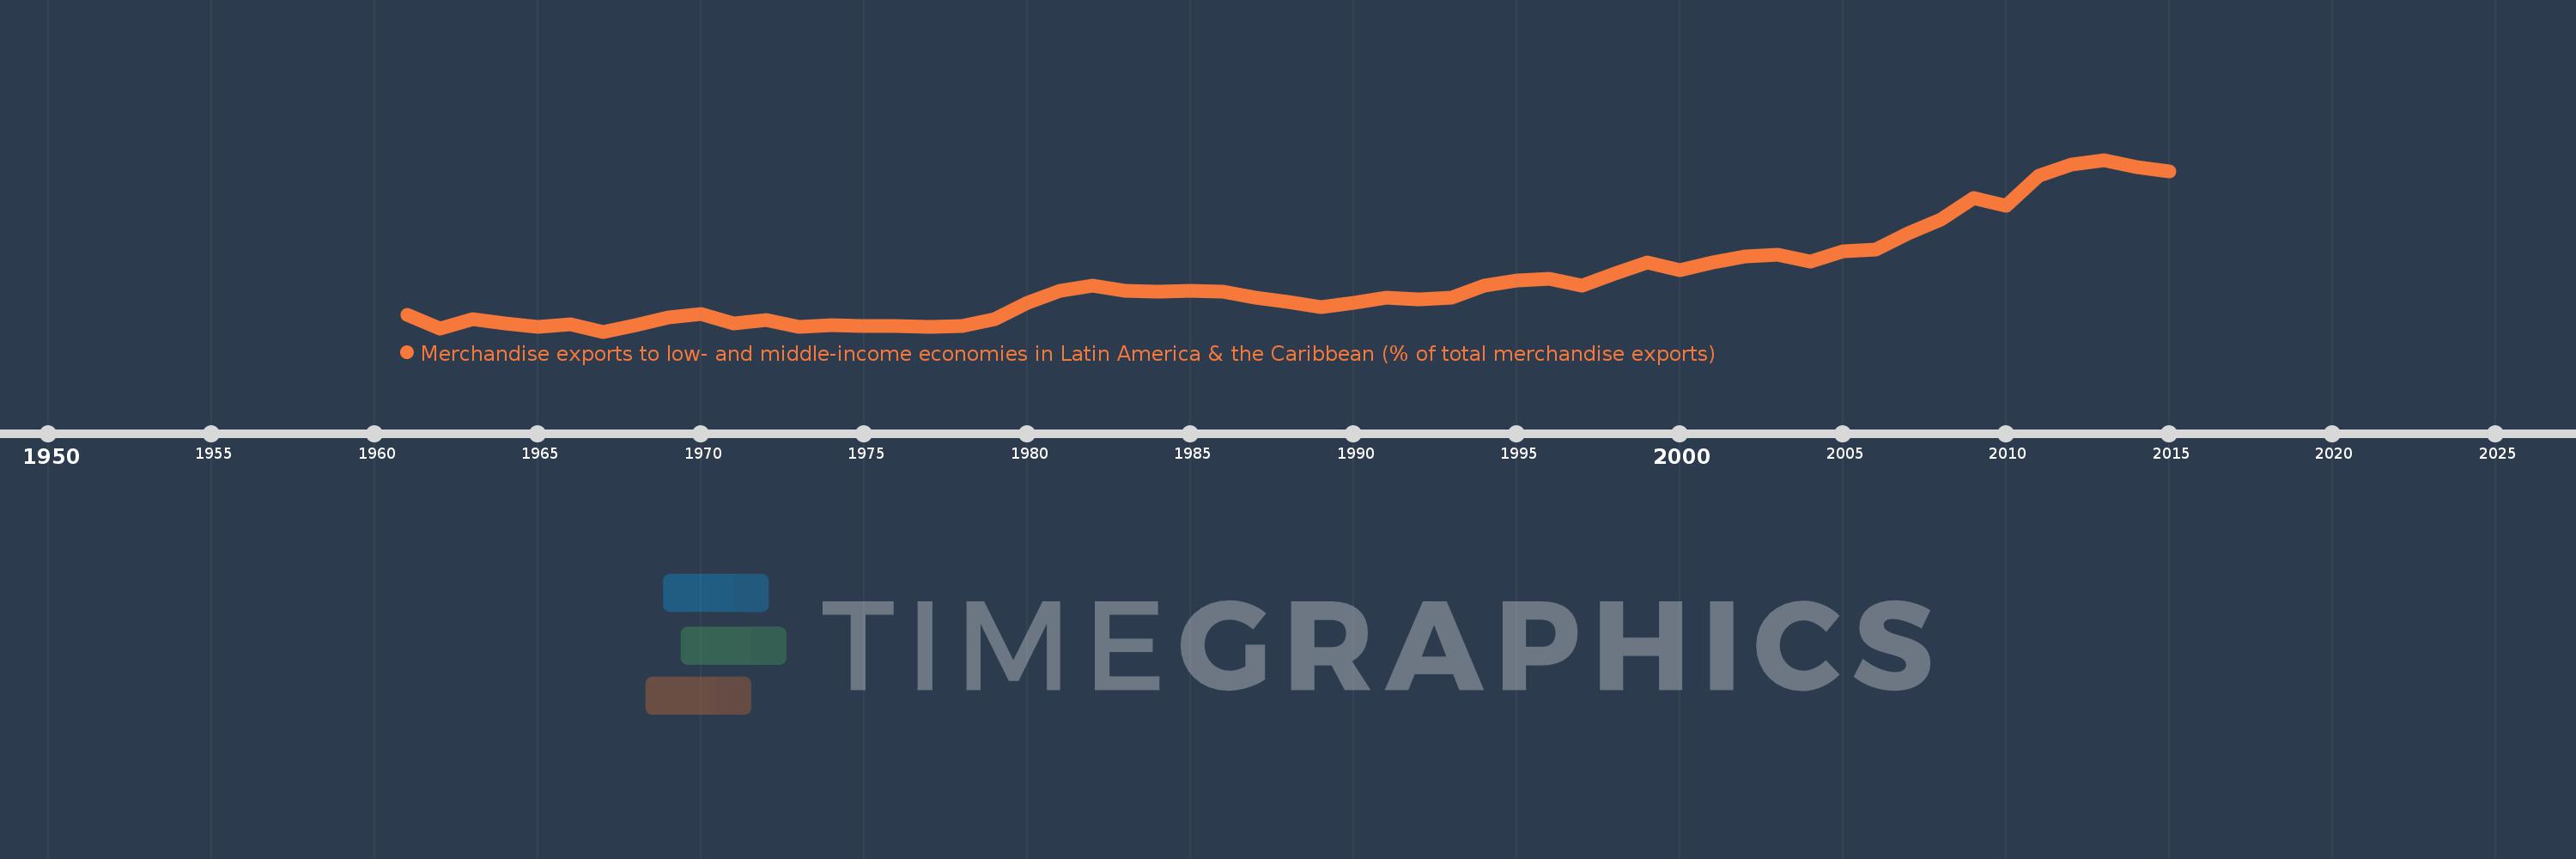
Merchandise exports to low- and middle-income economies in Latin America & the Caribbean (% of total merchandise exports)
2015,2014,2013,2012,2011,2010,2009,2008,2007,2006,2005,2004,2003,2002,2001,2000,1999,1998,1997,1996,1995,1994,1993,1992,1991,1990,1989,1988,1987,1986,1985,1984,1983,1982,1981,1980,1979,1978,1977,1976,1975,1974,1973,1972,1971,1970,1969,1968,1967,1966,1965,1964,1963,1962,1961
This statistics in other country:
AfghanistanAlbaniaAlgeriaAngolaAntigua and BarbudaArab WorldArgentinaArmeniaArubaAustraliaAustriaAzerbaijanBahamas, TheBahrainBangladeshBarbadosBelarusBelgiumBelizeBeninBermudaBoliviaBrazilBrunei DarussalamBulgariaBurundiCabo VerdeCambodiaCameroonCanadaCaribbean small statesCentral African RepublicCentral Europe and the BalticsChileChinaColombiaCongo, Dem. Rep.Congo, Rep.Costa RicaCote d'IvoireCroatiaCubaCyprusCzech RepublicDenmarkDominicaDominican RepublicEarly-demographic dividendEast Asia & PacificEast Asia & Pacific (excluding high income)East Asia & Pacific (IDA & IBRD countries)EcuadorEgypt, Arab Rep.El SalvadorEstoniaEthiopiaEuro areaEurope & Central AsiaEurope & Central Asia (excluding high income)Europe & Central Asia (IDA & IBRD countries)European UnionFaroe IslandsFijiFinlandFragile and conflict affected situationsFranceFrench PolynesiaGabonGambia, TheGeorgiaGermanyGhanaGibraltarGreeceGreenlandGrenadaGuatemalaGuineaGuyanaHaitiHeavily indebted poor countries (HIPC)High incomeHondurasHong Kong SAR, ChinaHungaryIBRD onlyIcelandIDA & IBRD totalIDA blendIDA onlyIDA totalIndiaIndonesiaIran, Islamic Rep.IraqIrelandIsraelItalyJamaicaJapanJordanKazakhstanKenyaKorea, Dem. People’s Rep.Korea, Rep.KuwaitLao PDRLate-demographic dividendLatin America & Caribbean Latin America & Caribbean (excluding high income)Latin America & the Caribbean (IDA & IBRD countries)LatviaLeast developed countries: UN classificationLebanonLiberiaLibyaLithuaniaLow & middle incomeLow incomeLower middle incomeLuxembourgMacao SAR, ChinaMacedonia, FYRMadagascarMalawiMalaysiaMaliMaltaMauritaniaMauritiusMexicoMiddle East & North AfricaMiddle East & North Africa (excluding high income)Middle East & North Africa (IDA & IBRD countries)Middle incomeMongoliaMontenegroMoroccoMozambiqueMyanmarNetherlandsNew CaledoniaNew ZealandNicaraguaNigerNigeriaNorth AmericaNorwayOECD membersOmanOther small statesPacific island small statesPakistanPanamaPapua New GuineaParaguayPeruPhilippinesPolandPortugalPost-demographic dividendPre-demographic dividendQatarRomaniaRussian FederationRwandaSamoaSaudi ArabiaSenegalSerbiaSierra LeoneSingaporeSlovak RepublicSloveniaSmall statesSomaliaSouth AfricaSouth AsiaSouth Asia (IDA & IBRD)SpainSri LankaSt. Kitts and NevisSt. LuciaSt. Vincent and the GrenadinesSub-Saharan Africa Sub-Saharan Africa (excluding high income)Sub-Saharan Africa (IDA & IBRD countries)SudanSurinameSwedenSwitzerlandSyrian Arab RepublicTanzaniaThailandTogoTrinidad and TobagoTunisiaTurkeyUgandaUkraineUnited Arab EmiratesUnited KingdomUnited StatesUpper middle incomeUruguayVenezuela, RBVietnamWorldYemen, Rep.ZambiaZimbabwe Timeline:
This timeline shows a graph from 1961 to 2015 of East Asia & Pacific (excluding high income). No data until 1960. Number of actual observations by date: 55.
Source name:
World Development Indicators
Source organization:
World Bank staff estimates based data from International Monetary Fund's Direction of Trade database.
Categories, topics:
Private Sector, Trade
Last updated:
apr 23, 2017
Indicators value changes by year
At the date of observation
Value
Absolute change
Change from previous value
jan 1, 1961
0.423
+0.423
0.0%
jan 1, 1962
0.117
-0.306
-72.26%
jan 1, 1963
0.338
+0.221
187.79%
jan 1, 1964
0.237
-0.101
-29.95%
jan 1, 1965
0.159
-0.078
-32.8%
jan 1, 1966
0.224
+0.064
40.53%
jan 1, 1967
0.047
-0.177
-79.0%
jan 1, 1968
0.203
+0.156
333.2%
jan 1, 1969
0.376
+0.173
85.08%
jan 1, 1970
0.444
+0.068
18.04%
jan 1, 1971
0.237
-0.208
-46.76%
jan 1, 1972
0.322
+0.085
35.99%
jan 1, 1973
0.164
-0.158
-49.11%
jan 1, 1974
0.195
+0.031
18.88%
jan 1, 1975
0.178
-0.016
-8.4%
jan 1, 1976
0.168
-0.01
-5.76%
jan 1, 1977
0.163
-0.005
-3.02%
jan 1, 1978
0.173
+0.01
6.43%
jan 1, 1979
0.323
+0.15
86.37%
jan 1, 1980
0.697
+0.374
115.63%
jan 1, 1981
0.985
+0.288
41.26%
jan 1, 1982
1.101
+0.117
11.84%
jan 1, 1983
0.977
-0.124
-11.29%
jan 1, 1984
0.969
-0.008
-0.81%
jan 1, 1985
0.99
+0.021
2.18%
jan 1, 1986
0.956
-0.034
-3.41%
jan 1, 1987
0.825
-0.131
-13.68%
jan 1, 1988
0.725
-0.1
-12.14%
jan 1, 1989
0.602
-0.123
-16.99%
jan 1, 1990
0.71
+0.108
17.98%
jan 1, 1991
0.82
+0.11
15.47%
jan 1, 1992
0.792
-0.028
-3.37%
jan 1, 1993
0.821
+0.029
3.62%
jan 1, 1994
1.093
+0.272
33.12%
jan 1, 1995
1.212
+0.119
10.85%
jan 1, 1996
1.266
+0.055
4.5%
jan 1, 1997
1.098
-0.168
-13.28%
jan 1, 1998
1.381
+0.283
25.74%
jan 1, 1999
1.635
+0.254
18.37%
jan 1, 2000
1.463
-0.171
-10.49%
jan 1, 2001
1.632
+0.169
11.55%
jan 1, 2002
1.764
+0.131
8.06%
jan 1, 2003
1.814
+0.051
2.88%
jan 1, 2004
1.645
-0.169
-9.33%
jan 1, 2005
1.891
+0.246
14.95%
jan 1, 2006
1.925
+0.034
1.82%
jan 1, 2007
2.304
+0.379
19.68%
jan 1, 2008
2.626
+0.322
13.96%
jan 1, 2009
3.108
+0.481
18.33%
jan 1, 2010
2.928
-0.18
-5.78%
jan 1, 2011
3.619
+0.692
23.62%
jan 1, 2012
3.883
+0.263
7.28%
jan 1, 2013
3.986
+0.103
2.65%
jan 1, 2014
3.815
-0.171
-4.28%
jan 1, 2015
3.715
-0.1
-2.63%
Ranking of countries by current statistics by years


Comments: