29
/
en
AIzaSyAYiBZKx7MnpbEhh9jyipgxe19OcubqV5w
April 1, 2024
106237
China
CHN
true
2
1
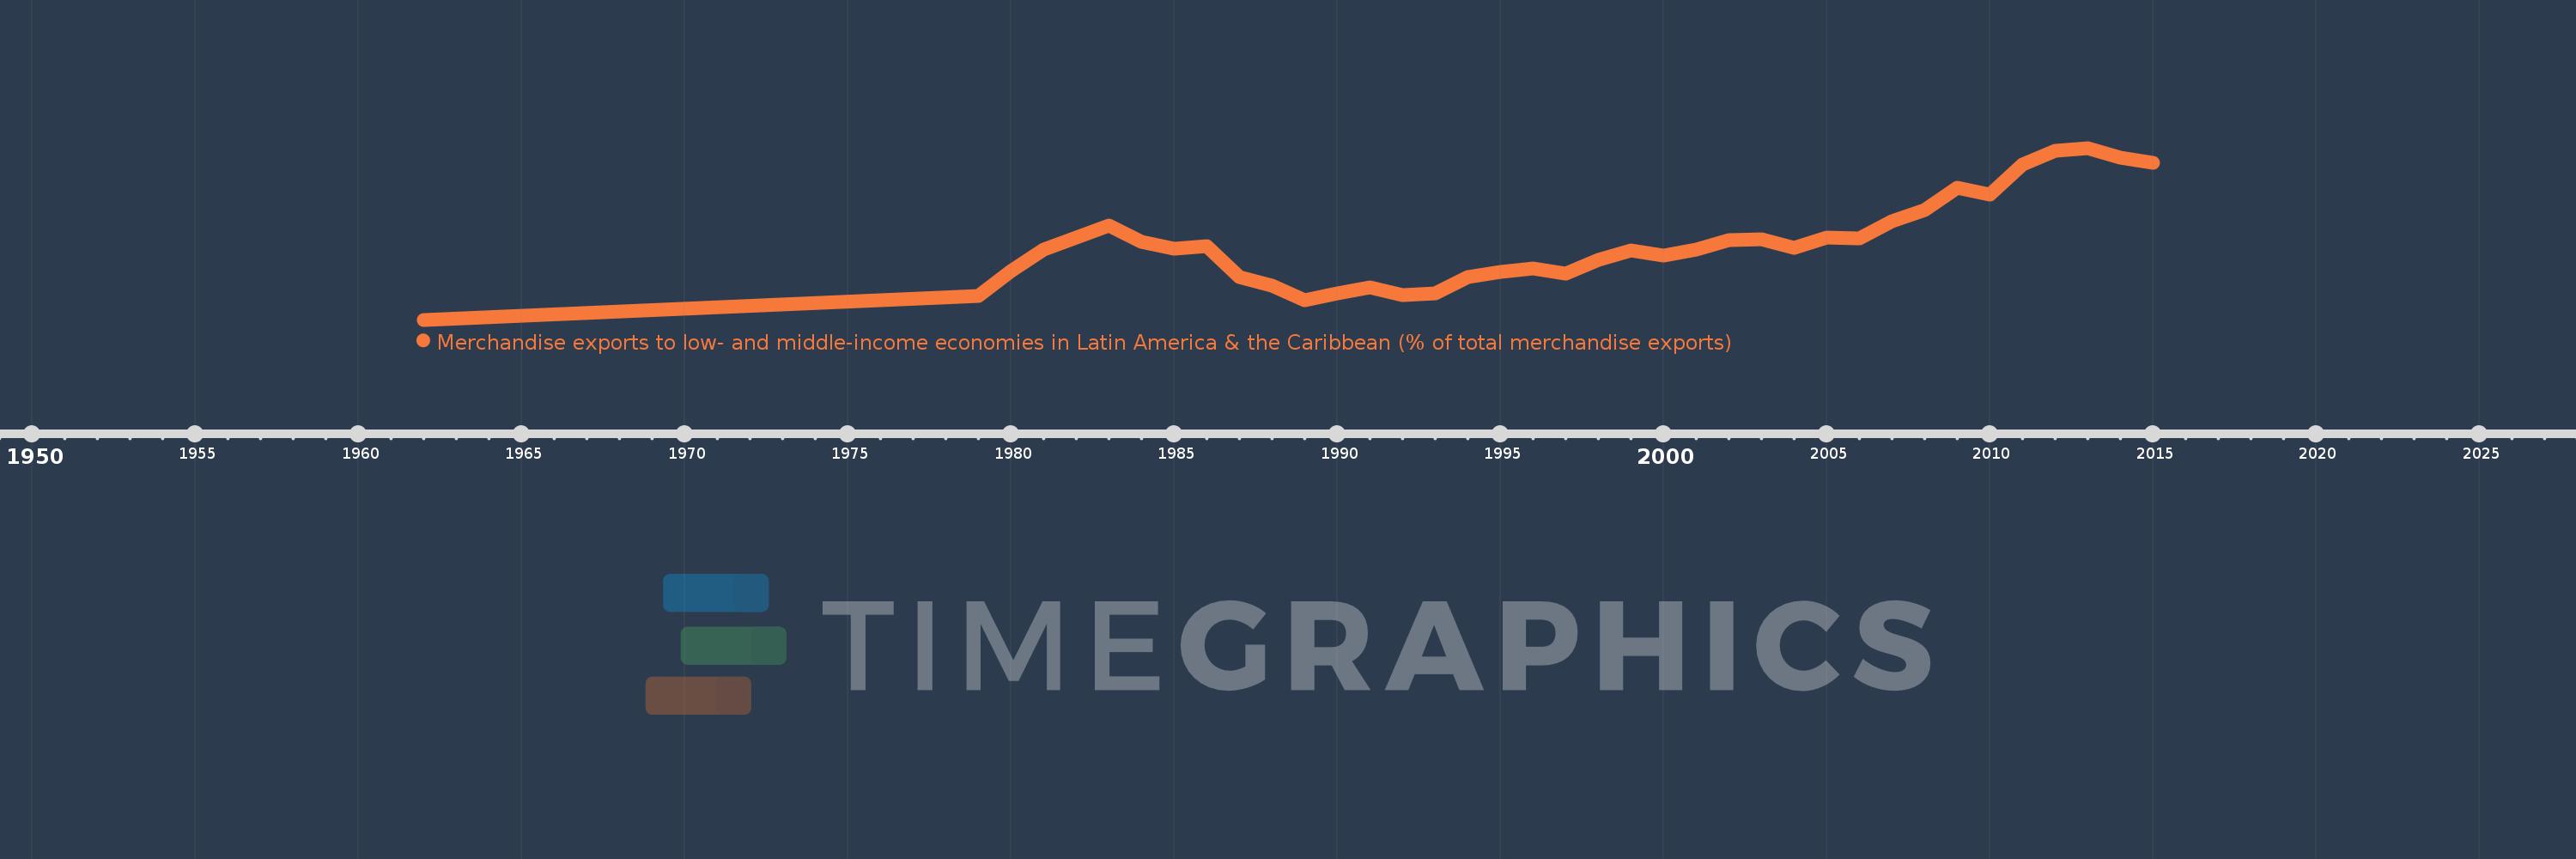
Merchandise exports to low- and middle-income economies in Latin America & the Caribbean (% of total merchandise exports)
2015,2014,2013,2012,2011,2010,2009,2008,2007,2006,2005,2004,2003,2002,2001,2000,1999,1998,1997,1996,1995,1994,1993,1992,1991,1990,1989,1988,1987,1986,1985,1984,1983,1982,1981,1980,1979,1962
Global statistics library →China →Merchandise exports to low- and middle-income economies in Latin America & the Caribbean (% of total merchandise exports)
This statistics in other country:
AfghanistanAlbaniaAlgeriaAngolaAntigua and BarbudaArab WorldArgentinaArmeniaArubaAustraliaAustriaAzerbaijanBahamas, TheBahrainBangladeshBarbadosBelarusBelgiumBelizeBeninBermudaBoliviaBrazilBrunei DarussalamBulgariaBurundiCabo VerdeCambodiaCameroonCanadaCaribbean small statesCentral African RepublicCentral Europe and the BalticsChileChinaColombiaCongo, Dem. Rep.Congo, Rep.Costa RicaCote d'IvoireCroatiaCubaCyprusCzech RepublicDenmarkDominicaDominican RepublicEarly-demographic dividendEast Asia & PacificEast Asia & Pacific (excluding high income)East Asia & Pacific (IDA & IBRD countries)EcuadorEgypt, Arab Rep.El SalvadorEstoniaEthiopiaEuro areaEurope & Central AsiaEurope & Central Asia (excluding high income)Europe & Central Asia (IDA & IBRD countries)European UnionFaroe IslandsFijiFinlandFragile and conflict affected situationsFranceFrench PolynesiaGabonGambia, TheGeorgiaGermanyGhanaGibraltarGreeceGreenlandGrenadaGuatemalaGuineaGuyanaHaitiHeavily indebted poor countries (HIPC)High incomeHondurasHong Kong SAR, ChinaHungaryIBRD onlyIcelandIDA & IBRD totalIDA blendIDA onlyIDA totalIndiaIndonesiaIran, Islamic Rep.IraqIrelandIsraelItalyJamaicaJapanJordanKazakhstanKenyaKorea, Dem. People’s Rep.Korea, Rep.KuwaitLao PDRLate-demographic dividendLatin America & Caribbean Latin America & Caribbean (excluding high income)Latin America & the Caribbean (IDA & IBRD countries)LatviaLeast developed countries: UN classificationLebanonLiberiaLibyaLithuaniaLow & middle incomeLow incomeLower middle incomeLuxembourgMacao SAR, ChinaMacedonia, FYRMadagascarMalawiMalaysiaMaliMaltaMauritaniaMauritiusMexicoMiddle East & North AfricaMiddle East & North Africa (excluding high income)Middle East & North Africa (IDA & IBRD countries)Middle incomeMongoliaMontenegroMoroccoMozambiqueMyanmarNetherlandsNew CaledoniaNew ZealandNicaraguaNigerNigeriaNorth AmericaNorwayOECD membersOmanOther small statesPacific island small statesPakistanPanamaPapua New GuineaParaguayPeruPhilippinesPolandPortugalPost-demographic dividendPre-demographic dividendQatarRomaniaRussian FederationRwandaSamoaSaudi ArabiaSenegalSerbiaSierra LeoneSingaporeSlovak RepublicSloveniaSmall statesSomaliaSouth AfricaSouth AsiaSouth Asia (IDA & IBRD)SpainSri LankaSt. Kitts and NevisSt. LuciaSt. Vincent and the GrenadinesSub-Saharan Africa Sub-Saharan Africa (excluding high income)Sub-Saharan Africa (IDA & IBRD countries)SudanSurinameSwedenSwitzerlandSyrian Arab RepublicTanzaniaThailandTogoTrinidad and TobagoTunisiaTurkeyUgandaUkraineUnited Arab EmiratesUnited KingdomUnited StatesUpper middle incomeUruguayVenezuela, RBVietnamWorldYemen, Rep.ZambiaZimbabwe Timeline:
This timeline shows a graph from 1962 to 2015 of China. No data until 1961. Number of actual observations by date: 38.
Source name:
World Development Indicators
Source organization:
World Bank staff estimates based data from International Monetary Fund's Direction of Trade database.
Categories, topics:
Private Sector, Trade
Last updated:
apr 23, 2017
Indicators value changes by year
At the date of observation
Value
Absolute change
Change from previous value
jan 1, 1962
0.128
+0.128
0.0%
jan 1, 1979
0.793
+0.665
520.71%
jan 1, 1980
1.466
+0.673
84.95%
jan 1, 1981
2.066
+0.6
40.93%
jan 1, 1982
2.414
+0.347
16.81%
jan 1, 1983
2.727
+0.313
12.98%
jan 1, 1984
2.281
-0.446
-16.36%
jan 1, 1985
2.092
-0.189
-8.27%
jan 1, 1986
2.163
+0.071
3.4%
jan 1, 1987
1.315
-0.848
-39.2%
jan 1, 1988
1.064
-0.251
-19.09%
jan 1, 1989
0.664
-0.4
-37.61%
jan 1, 1990
0.849
+0.185
27.81%
jan 1, 1991
1.021
+0.172
20.32%
jan 1, 1992
0.817
-0.204
-20.02%
jan 1, 1993
0.849
+0.032
3.9%
jan 1, 1994
1.309
+0.46
54.24%
jan 1, 1995
1.451
+0.143
10.89%
jan 1, 1996
1.548
+0.096
6.65%
jan 1, 1997
1.398
-0.15
-9.69%
jan 1, 1998
1.795
+0.397
28.38%
jan 1, 1999
2.048
+0.253
14.1%
jan 1, 2000
1.902
-0.146
-7.13%
jan 1, 2001
2.067
+0.165
8.68%
jan 1, 2002
2.321
+0.254
12.31%
jan 1, 2003
2.345
+0.024
1.05%
jan 1, 2004
2.129
-0.216
-9.22%
jan 1, 2005
2.41
+0.28
13.17%
jan 1, 2006
2.383
-0.027
-1.1%
jan 1, 2007
2.85
+0.467
19.58%
jan 1, 2008
3.168
+0.318
11.16%
jan 1, 2009
3.776
+0.608
19.21%
jan 1, 2010
3.59
-0.187
-4.94%
jan 1, 2011
4.428
+0.839
23.37%
jan 1, 2012
4.81
+0.382
8.62%
jan 1, 2013
4.885
+0.075
1.55%
jan 1, 2014
4.621
-0.263
-5.39%
jan 1, 2015
4.465
-0.156
-3.37%
Ranking of countries by current statistics by years


Comments: