29
/
en
AIzaSyAYiBZKx7MnpbEhh9jyipgxe19OcubqV5w
April 1, 2024
91414
Brazil
BRA
true
2
1
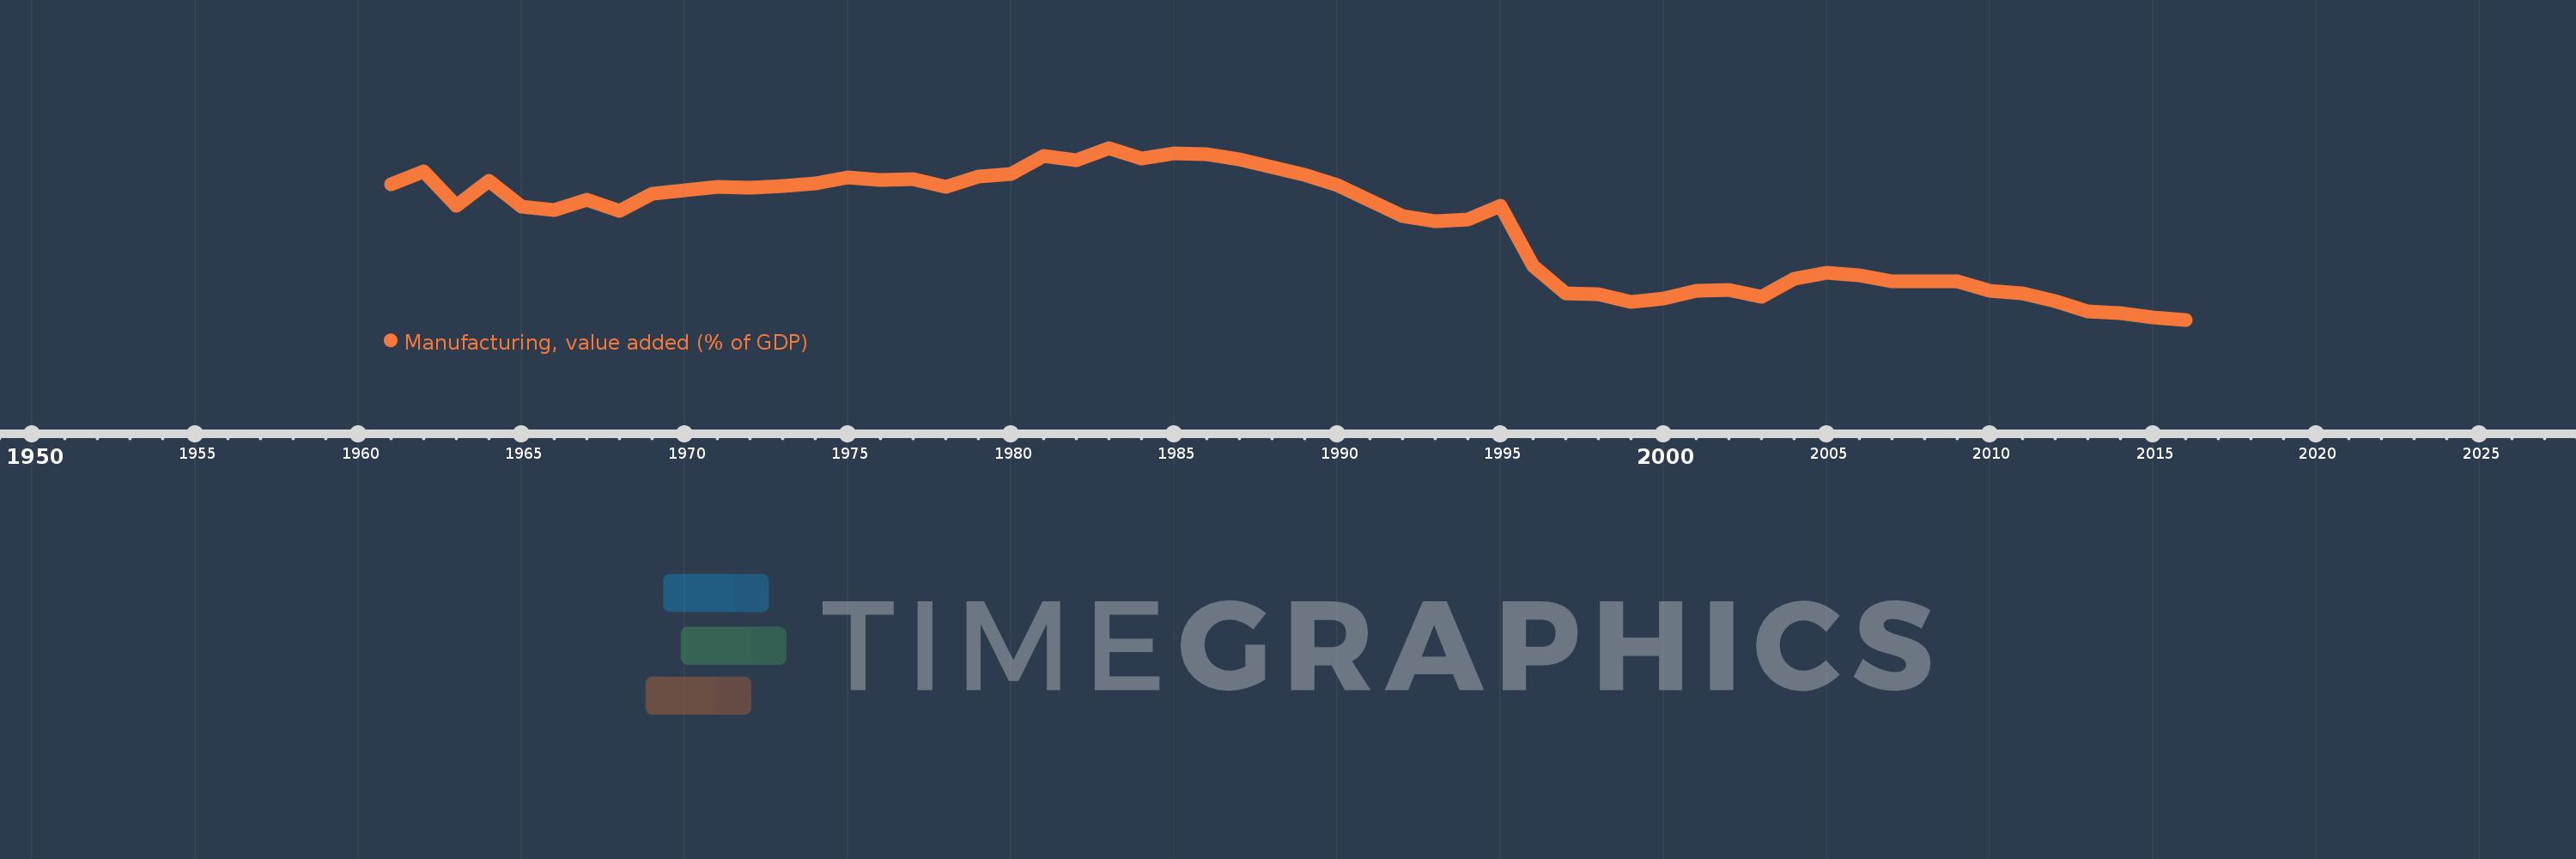
Manufacturing, value added (% of GDP)
2016,2015,2014,2013,2012,2011,2010,2009,2008,2007,2006,2005,2004,2003,2002,2001,2000,1999,1998,1997,1996,1995,1994,1993,1992,1990,1989,1988,1987,1986,1985,1984,1983,1982,1981,1980,1979,1978,1977,1976,1975,1974,1973,1972,1971,1970,1969,1968,1967,1966,1965,1964,1963,1962,1961
This statistics in other country:
AfghanistanAlbaniaAlgeriaAndorraAngolaAntigua and BarbudaArab WorldArgentinaArmeniaArubaAustraliaAustriaAzerbaijanBahamas, TheBahrainBangladeshBarbadosBelarusBelgiumBelizeBeninBermudaBhutanBoliviaBosnia and HerzegovinaBotswanaBrazilBrunei DarussalamBurkina FasoBurundiCabo VerdeCambodiaCameroonCanadaCaribbean small statesCayman IslandsCentral African RepublicCentral Europe and the BalticsChadChileChinaColombiaComorosCongo, Dem. Rep.Congo, Rep.Costa RicaCote d'IvoireCroatiaCubaCyprusCzech RepublicDenmarkDjiboutiDominicaDominican RepublicEarly-demographic dividendEast Asia & PacificEast Asia & Pacific (excluding high income)East Asia & Pacific (IDA & IBRD countries)EcuadorEgypt, Arab Rep.El SalvadorEquatorial GuineaEritreaEstoniaEthiopiaEuro areaEurope & Central AsiaEurope & Central Asia (excluding high income)Europe & Central Asia (IDA & IBRD countries)European UnionFaroe IslandsFijiFinlandFragile and conflict affected situationsFranceGabonGambia, TheGeorgiaGermanyGhanaGreeceGrenadaGuatemalaGuineaGuinea-BissauGuyanaHeavily indebted poor countries (HIPC)High incomeHondurasHong Kong SAR, ChinaHungaryIBRD onlyIcelandIDA & IBRD totalIDA blendIDA onlyIDA totalIndiaIndonesiaIran, Islamic Rep.IrelandItalyJamaicaJapanJordanKazakhstanKenyaKiribatiKorea, Rep.KosovoKuwaitKyrgyz RepublicLao PDRLate-demographic dividendLatin America & Caribbean Latin America & Caribbean (excluding high income)Latin America & the Caribbean (IDA & IBRD countries)LatviaLeast developed countries: UN classificationLebanonLesothoLibyaLithuaniaLow & middle incomeLow incomeLower middle incomeLuxembourgMacao SAR, ChinaMacedonia, FYRMadagascarMalawiMalaysiaMaldivesMaliMaltaMarshall IslandsMauritaniaMauritiusMexicoMicronesia, Fed. Sts.Middle East & North AfricaMiddle East & North Africa (excluding high income)Middle East & North Africa (IDA & IBRD countries)Middle incomeMoldovaMongoliaMontenegroMoroccoMozambiqueMyanmarNamibiaNepalNetherlandsNew CaledoniaNew ZealandNicaraguaNigerNigeriaNorth AmericaNorwayOECD membersOmanOther small statesPacific island small statesPakistanPalauPanamaPapua New GuineaParaguayPeruPhilippinesPolandPortugalPost-demographic dividendPre-demographic dividendPuerto RicoQatarRomaniaRussian FederationRwandaSao Tome and PrincipeSaudi ArabiaSenegalSerbiaSeychellesSierra LeoneSingaporeSlovak RepublicSloveniaSmall statesSolomon IslandsSomaliaSouth AfricaSouth AsiaSouth Asia (IDA & IBRD)SpainSri LankaSt. Kitts and NevisSt. LuciaSt. Vincent and the GrenadinesSub-Saharan Africa Sub-Saharan Africa (excluding high income)Sub-Saharan Africa (IDA & IBRD countries)SudanSurinameSwazilandSwedenSwitzerlandSyrian Arab RepublicTajikistanTanzaniaThailandTimor-LesteTogoTongaTrinidad and TobagoTunisiaTurkeyTurkmenistanTuvaluUgandaUkraineUnited KingdomUnited StatesUpper middle incomeUruguayUzbekistanVanuatuVenezuela, RBVietnamWest Bank and GazaWorldYemen, Rep.ZambiaZimbabwe Timeline:
This timeline shows a graph from 1961 to 2016 of Brazil. No data until 1960. Number of actual observations by date: 55.
Source name:
World Development Indicators
Source organization:
World Bank national accounts data, and OECD National Accounts data files.
Categories, topics:
Economy & Growth
Last updated:
apr 23, 2017
Indicators value changes by year
Minimum:
11.402
jan 1, 2016
At the date of observation
Value
Absolute change
Change from previous value
jan 1, 1961
29.607
+29.607
0.0%
jan 1, 1962
31.385
+1.777
6.0%
jan 1, 1963
26.748
-4.636
-14.77%
jan 1, 1964
30.177
+3.429
12.82%
jan 1, 1965
26.615
-3.563
-11.81%
jan 1, 1966
26.197
-0.418
-1.57%
jan 1, 1967
27.615
+1.418
5.41%
jan 1, 1968
26.067
-1.548
-5.61%
jan 1, 1969
28.348
+2.281
8.75%
jan 1, 1970
28.851
+0.504
1.78%
jan 1, 1971
29.317
+0.466
1.61%
jan 1, 1972
29.191
-0.126
-0.43%
jan 1, 1973
29.398
+0.207
0.71%
jan 1, 1974
29.805
+0.407
1.38%
jan 1, 1975
30.552
+0.747
2.51%
jan 1, 1976
30.264
-0.289
-0.94%
jan 1, 1977
30.397
+0.133
0.44%
jan 1, 1978
29.345
-1.052
-3.46%
jan 1, 1979
30.72
+1.375
4.69%
jan 1, 1980
31.041
+0.321
1.04%
jan 1, 1981
33.485
+2.444
7.87%
jan 1, 1982
32.92
-0.565
-1.69%
jan 1, 1983
34.56
+1.64
4.98%
jan 1, 1984
33.19
-1.37
-3.96%
jan 1, 1985
33.873
+0.683
2.06%
jan 1, 1986
33.747
-0.125
-0.37%
jan 1, 1987
32.969
-0.778
-2.31%
jan 1, 1988
31.956
-1.013
-3.07%
jan 1, 1989
30.955
-1.002
-3.13%
jan 1, 1990
29.529
-1.426
-4.61%
jan 1, 1992
25.343
-4.185
-14.17%
jan 1, 1993
24.656
-0.687
-2.71%
jan 1, 1994
24.954
+0.298
1.21%
jan 1, 1995
26.79
+1.836
7.36%
jan 1, 1996
18.616
-8.174
-30.51%
jan 1, 1997
14.946
-3.669
-19.71%
jan 1, 1998
14.813
-0.133
-0.89%
jan 1, 1999
13.815
-0.999
-6.74%
jan 1, 2000
14.214
+0.399
2.89%
jan 1, 2001
15.271
+1.058
7.44%
jan 1, 2002
15.372
+0.1
0.66%
jan 1, 2003
14.483
-0.888
-5.78%
jan 1, 2004
16.88
+2.397
16.55%
jan 1, 2005
17.787
+0.907
5.37%
jan 1, 2006
17.36
-0.427
-2.4%
jan 1, 2007
16.589
-0.771
-4.44%
jan 1, 2008
16.6
+0.011
0.07%
jan 1, 2009
16.523
-0.076
-0.46%
jan 1, 2010
15.274
-1.249
-7.56%
jan 1, 2011
14.968
-0.307
-2.01%
jan 1, 2012
13.871
-1.096
-7.32%
jan 1, 2013
12.582
-1.29
-9.3%
jan 1, 2014
12.311
-0.271
-2.16%
jan 1, 2015
11.673
-0.637
-5.18%
jan 1, 2016
11.402
-0.271
-2.32%
Ranking of countries by current statistics by years


Comments: