29
/
en
AIzaSyAYiBZKx7MnpbEhh9jyipgxe19OcubqV5w
April 1, 2024
208171
Netherlands
NLD
true
2
1
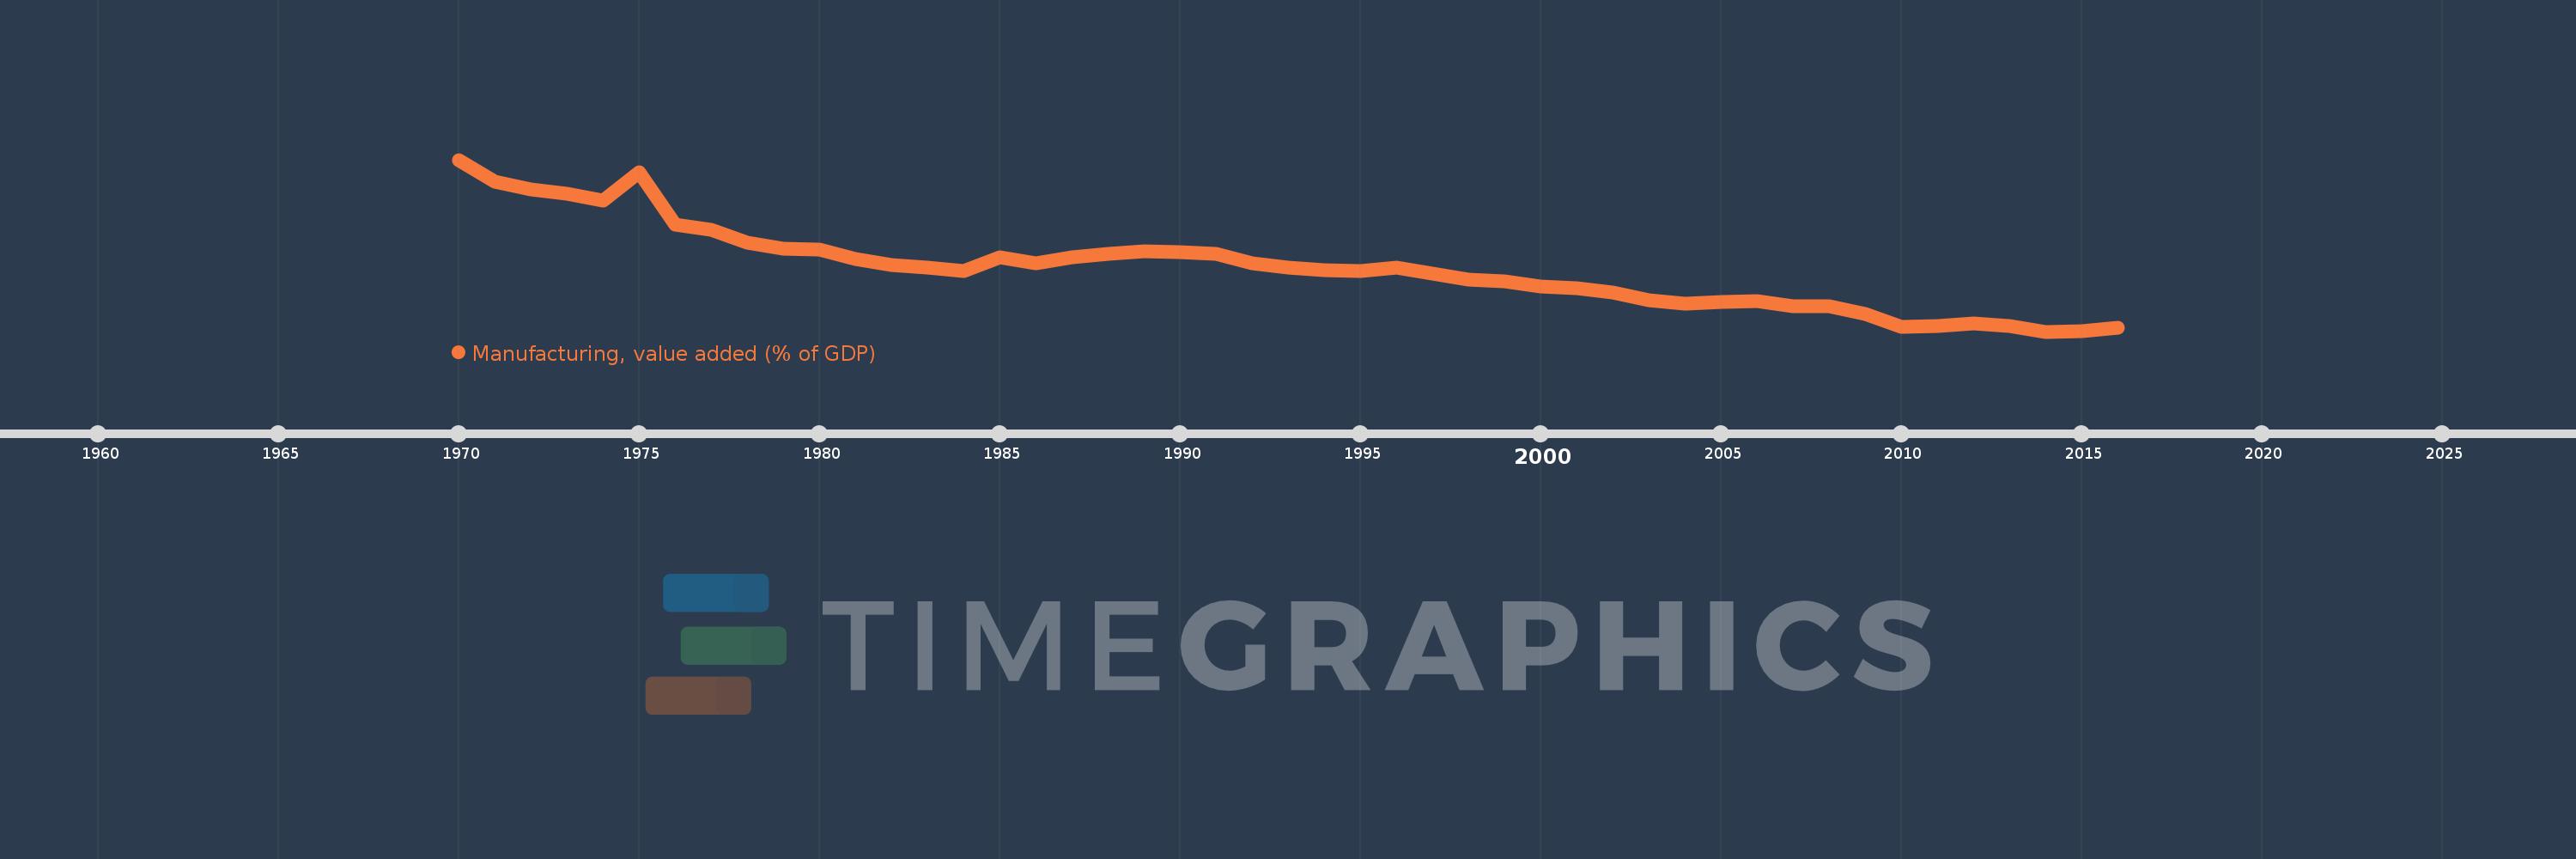
Manufacturing, value added (% of GDP)
2016,2015,2014,2013,2012,2011,2010,2009,2008,2007,2006,2005,2004,2003,2002,2001,2000,1999,1998,1997,1996,1995,1994,1993,1992,1991,1990,1989,1988,1987,1986,1985,1984,1983,1982,1981,1980,1979,1978,1977,1976,1975,1974,1973,1972,1971,1970
This statistics in other country:
AfghanistanAlbaniaAlgeriaAndorraAngolaAntigua and BarbudaArab WorldArgentinaArmeniaArubaAustraliaAustriaAzerbaijanBahamas, TheBahrainBangladeshBarbadosBelarusBelgiumBelizeBeninBermudaBhutanBoliviaBosnia and HerzegovinaBotswanaBrazilBrunei DarussalamBurkina FasoBurundiCabo VerdeCambodiaCameroonCanadaCaribbean small statesCayman IslandsCentral African RepublicCentral Europe and the BalticsChadChileChinaColombiaComorosCongo, Dem. Rep.Congo, Rep.Costa RicaCote d'IvoireCroatiaCubaCyprusCzech RepublicDenmarkDjiboutiDominicaDominican RepublicEarly-demographic dividendEast Asia & PacificEast Asia & Pacific (excluding high income)East Asia & Pacific (IDA & IBRD countries)EcuadorEgypt, Arab Rep.El SalvadorEquatorial GuineaEritreaEstoniaEthiopiaEuro areaEurope & Central AsiaEurope & Central Asia (excluding high income)Europe & Central Asia (IDA & IBRD countries)European UnionFaroe IslandsFijiFinlandFragile and conflict affected situationsFranceGabonGambia, TheGeorgiaGermanyGhanaGreeceGrenadaGuatemalaGuineaGuinea-BissauGuyanaHeavily indebted poor countries (HIPC)High incomeHondurasHong Kong SAR, ChinaHungaryIBRD onlyIcelandIDA & IBRD totalIDA blendIDA onlyIDA totalIndiaIndonesiaIran, Islamic Rep.IrelandItalyJamaicaJapanJordanKazakhstanKenyaKiribatiKorea, Rep.KosovoKuwaitKyrgyz RepublicLao PDRLate-demographic dividendLatin America & Caribbean Latin America & Caribbean (excluding high income)Latin America & the Caribbean (IDA & IBRD countries)LatviaLeast developed countries: UN classificationLebanonLesothoLibyaLithuaniaLow & middle incomeLow incomeLower middle incomeLuxembourgMacao SAR, ChinaMacedonia, FYRMadagascarMalawiMalaysiaMaldivesMaliMaltaMarshall IslandsMauritaniaMauritiusMexicoMicronesia, Fed. Sts.Middle East & North AfricaMiddle East & North Africa (excluding high income)Middle East & North Africa (IDA & IBRD countries)Middle incomeMoldovaMongoliaMontenegroMoroccoMozambiqueMyanmarNamibiaNepalNetherlandsNew CaledoniaNew ZealandNicaraguaNigerNigeriaNorth AmericaNorwayOECD membersOmanOther small statesPacific island small statesPakistanPalauPanamaPapua New GuineaParaguayPeruPhilippinesPolandPortugalPost-demographic dividendPre-demographic dividendPuerto RicoQatarRomaniaRussian FederationRwandaSao Tome and PrincipeSaudi ArabiaSenegalSerbiaSeychellesSierra LeoneSingaporeSlovak RepublicSloveniaSmall statesSolomon IslandsSomaliaSouth AfricaSouth AsiaSouth Asia (IDA & IBRD)SpainSri LankaSt. Kitts and NevisSt. LuciaSt. Vincent and the GrenadinesSub-Saharan Africa Sub-Saharan Africa (excluding high income)Sub-Saharan Africa (IDA & IBRD countries)SudanSurinameSwazilandSwedenSwitzerlandSyrian Arab RepublicTajikistanTanzaniaThailandTimor-LesteTogoTongaTrinidad and TobagoTunisiaTurkeyTurkmenistanTuvaluUgandaUkraineUnited KingdomUnited StatesUpper middle incomeUruguayUzbekistanVanuatuVenezuela, RBVietnamWest Bank and GazaWorldYemen, Rep.ZambiaZimbabwe Timeline:
This timeline shows a graph from 1970 to 2016 of Netherlands. No data until 1969. Number of actual observations by date: 47.
Source name:
World Development Indicators
Source organization:
World Bank national accounts data, and OECD National Accounts data files.
Categories, topics:
Economy & Growth
Last updated:
apr 23, 2017
Indicators value changes by year
Minimum:
11.329
jan 1, 2014
At the date of observation
Value
Absolute change
Change from previous value
jan 1, 1970
26.97
+26.97
0.0%
jan 1, 1971
24.967
-2.003
-7.43%
jan 1, 1972
24.287
-0.68
-2.72%
jan 1, 1973
23.879
-0.408
-1.68%
jan 1, 1974
23.272
-0.607
-2.54%
jan 1, 1975
25.833
+2.561
11.0%
jan 1, 1976
21.066
-4.766
-18.45%
jan 1, 1977
20.628
-0.438
-2.08%
jan 1, 1978
19.447
-1.181
-5.73%
jan 1, 1979
18.839
-0.607
-3.12%
jan 1, 1980
18.802
-0.038
-0.2%
jan 1, 1981
17.958
-0.844
-4.49%
jan 1, 1982
17.372
-0.586
-3.26%
jan 1, 1983
17.141
-0.231
-1.33%
jan 1, 1984
16.862
-0.279
-1.63%
jan 1, 1985
18.098
+1.236
7.33%
jan 1, 1986
17.579
-0.519
-2.87%
jan 1, 1987
18.104
+0.525
2.99%
jan 1, 1988
18.384
+0.28
1.55%
jan 1, 1989
18.604
+0.219
1.19%
jan 1, 1990
18.601
-0.003
-0.02%
jan 1, 1991
18.37
-0.231
-1.24%
jan 1, 1992
17.567
-0.802
-4.37%
jan 1, 1993
17.18
-0.387
-2.21%
jan 1, 1994
16.952
-0.228
-1.32%
jan 1, 1995
16.845
-0.107
-0.63%
jan 1, 1996
17.172
+0.327
1.94%
jan 1, 1997
16.582
-0.59
-3.43%
jan 1, 1998
16.077
-0.506
-3.05%
jan 1, 1999
15.916
-0.161
-1.0%
jan 1, 2000
15.462
-0.453
-2.85%
jan 1, 2001
15.251
-0.211
-1.37%
jan 1, 2002
14.891
-0.36
-2.36%
jan 1, 2003
14.203
-0.688
-4.62%
jan 1, 2004
13.833
-0.37
-2.6%
jan 1, 2005
14.021
+0.188
1.36%
jan 1, 2006
14.079
+0.058
0.41%
jan 1, 2007
13.616
-0.463
-3.29%
jan 1, 2008
13.674
+0.057
0.42%
jan 1, 2009
12.945
-0.729
-5.33%
jan 1, 2010
11.74
-1.204
-9.3%
jan 1, 2011
11.805
+0.065
0.55%
jan 1, 2012
12.074
+0.269
2.28%
jan 1, 2013
11.831
-0.243
-2.01%
jan 1, 2014
11.329
-0.502
-4.24%
jan 1, 2015
11.383
+0.054
0.48%
jan 1, 2016
11.7
+0.317
2.78%
Ranking of countries by current statistics by years


Comments: