29
/
en
AIzaSyAYiBZKx7MnpbEhh9jyipgxe19OcubqV5w
April 1, 2024
108749
Comoros
COM
true
2
1
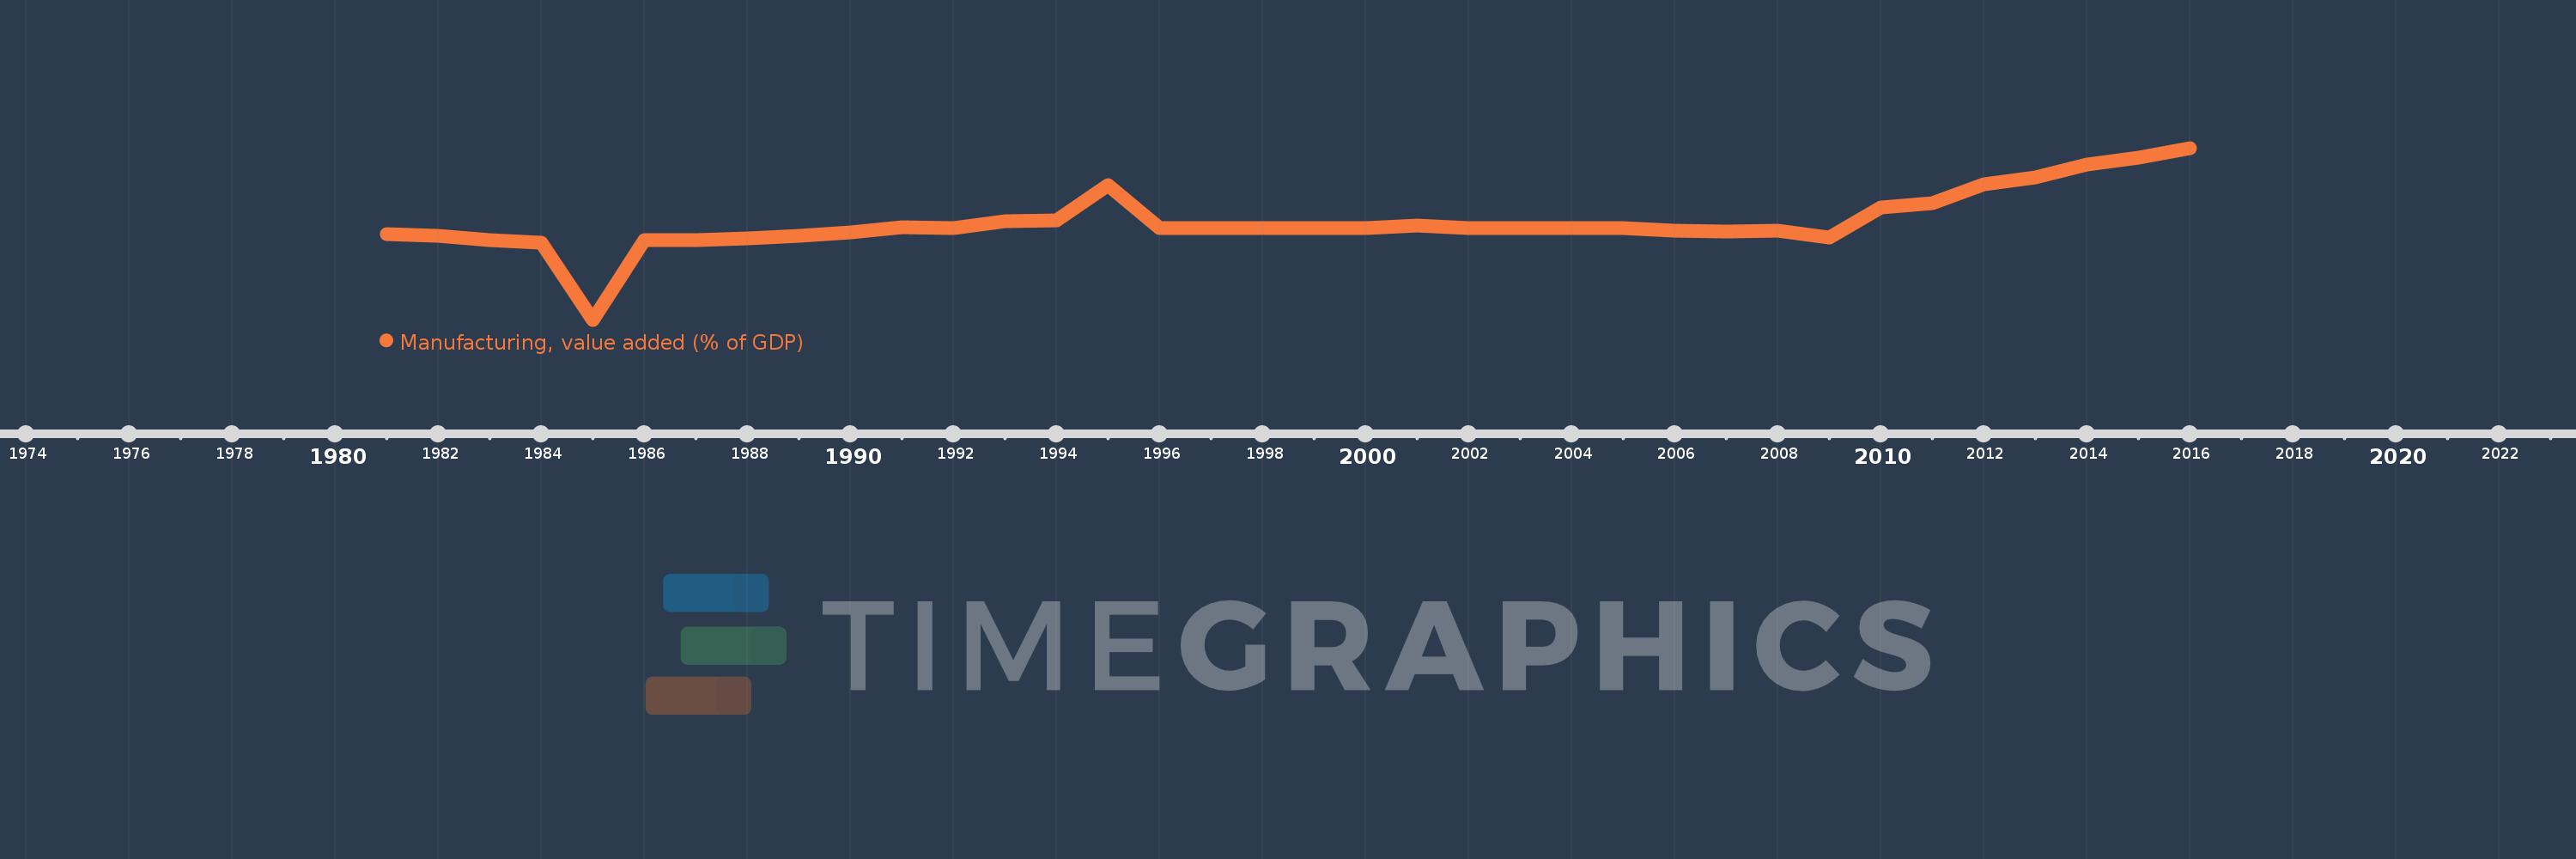
Manufacturing, value added (% of GDP)
2016,2015,2014,2013,2012,2011,2010,2009,2008,2007,2006,2005,2004,2003,2002,2001,2000,1999,1998,1997,1996,1995,1994,1993,1992,1991,1990,1989,1988,1987,1986,1985,1984,1983,1982,1981
This statistics in other country:
AfghanistanAlbaniaAlgeriaAndorraAngolaAntigua and BarbudaArab WorldArgentinaArmeniaArubaAustraliaAustriaAzerbaijanBahamas, TheBahrainBangladeshBarbadosBelarusBelgiumBelizeBeninBermudaBhutanBoliviaBosnia and HerzegovinaBotswanaBrazilBrunei DarussalamBurkina FasoBurundiCabo VerdeCambodiaCameroonCanadaCaribbean small statesCayman IslandsCentral African RepublicCentral Europe and the BalticsChadChileChinaColombiaComorosCongo, Dem. Rep.Congo, Rep.Costa RicaCote d'IvoireCroatiaCubaCyprusCzech RepublicDenmarkDjiboutiDominicaDominican RepublicEarly-demographic dividendEast Asia & PacificEast Asia & Pacific (excluding high income)East Asia & Pacific (IDA & IBRD countries)EcuadorEgypt, Arab Rep.El SalvadorEquatorial GuineaEritreaEstoniaEthiopiaEuro areaEurope & Central AsiaEurope & Central Asia (excluding high income)Europe & Central Asia (IDA & IBRD countries)European UnionFaroe IslandsFijiFinlandFragile and conflict affected situationsFranceGabonGambia, TheGeorgiaGermanyGhanaGreeceGrenadaGuatemalaGuineaGuinea-BissauGuyanaHeavily indebted poor countries (HIPC)High incomeHondurasHong Kong SAR, ChinaHungaryIBRD onlyIcelandIDA & IBRD totalIDA blendIDA onlyIDA totalIndiaIndonesiaIran, Islamic Rep.IrelandItalyJamaicaJapanJordanKazakhstanKenyaKiribatiKorea, Rep.KosovoKuwaitKyrgyz RepublicLao PDRLate-demographic dividendLatin America & Caribbean Latin America & Caribbean (excluding high income)Latin America & the Caribbean (IDA & IBRD countries)LatviaLeast developed countries: UN classificationLebanonLesothoLibyaLithuaniaLow & middle incomeLow incomeLower middle incomeLuxembourgMacao SAR, ChinaMacedonia, FYRMadagascarMalawiMalaysiaMaldivesMaliMaltaMarshall IslandsMauritaniaMauritiusMexicoMicronesia, Fed. Sts.Middle East & North AfricaMiddle East & North Africa (excluding high income)Middle East & North Africa (IDA & IBRD countries)Middle incomeMoldovaMongoliaMontenegroMoroccoMozambiqueMyanmarNamibiaNepalNetherlandsNew CaledoniaNew ZealandNicaraguaNigerNigeriaNorth AmericaNorwayOECD membersOmanOther small statesPacific island small statesPakistanPalauPanamaPapua New GuineaParaguayPeruPhilippinesPolandPortugalPost-demographic dividendPre-demographic dividendPuerto RicoQatarRomaniaRussian FederationRwandaSao Tome and PrincipeSaudi ArabiaSenegalSerbiaSeychellesSierra LeoneSingaporeSlovak RepublicSloveniaSmall statesSolomon IslandsSomaliaSouth AfricaSouth AsiaSouth Asia (IDA & IBRD)SpainSri LankaSt. Kitts and NevisSt. LuciaSt. Vincent and the GrenadinesSub-Saharan Africa Sub-Saharan Africa (excluding high income)Sub-Saharan Africa (IDA & IBRD countries)SudanSurinameSwazilandSwedenSwitzerlandSyrian Arab RepublicTajikistanTanzaniaThailandTimor-LesteTogoTongaTrinidad and TobagoTunisiaTurkeyTurkmenistanTuvaluUgandaUkraineUnited KingdomUnited StatesUpper middle incomeUruguayUzbekistanVanuatuVenezuela, RBVietnamWest Bank and GazaWorldYemen, Rep.ZambiaZimbabwe Timeline:
This timeline shows a graph from 1981 to 2016 of Comoros. No data until 1980. Number of actual observations by date: 36.
Source name:
World Development Indicators
Source organization:
World Bank national accounts data, and OECD National Accounts data files.
Categories, topics:
Economy & Growth
Last updated:
apr 23, 2017
Indicators value changes by year
At the date of observation
Value
Absolute change
Change from previous value
jan 1, 1981
3.913
+3.913
0.0%
jan 1, 1982
3.855
-0.058
-1.48%
jan 1, 1983
3.671
-0.183
-4.76%
jan 1, 1984
3.567
-0.104
-2.84%
jan 1, 1985
0.364
-3.203
-89.79%
jan 1, 1986
3.669
+3.305
907.65%
jan 1, 1987
3.664
-0.004
-0.11%
jan 1, 1988
3.744
+0.079
2.16%
jan 1, 1989
3.84
+0.097
2.58%
jan 1, 1990
3.995
+0.155
4.05%
jan 1, 1991
4.209
+0.213
5.34%
jan 1, 1992
4.178
-0.031
-0.73%
jan 1, 1993
4.448
+0.27
6.47%
jan 1, 1994
4.498
+0.05
1.12%
jan 1, 1995
5.965
+1.467
32.61%
jan 1, 1996
4.163
-1.802
-30.21%
jan 1, 1997
4.163
0.0
-0.01%
jan 1, 1998
4.163
+0.0
0.01%
jan 1, 1999
4.164
+0.001
0.02%
jan 1, 2000
4.163
0.0
-0.01%
jan 1, 2001
4.296
+0.133
3.2%
jan 1, 2002
4.163
-0.134
-3.11%
jan 1, 2003
4.187
+0.024
0.58%
jan 1, 2004
4.187
+0.0
0.0%
jan 1, 2005
4.186
-0.001
-0.01%
jan 1, 2006
4.07
-0.116
-2.76%
jan 1, 2007
4.044
-0.026
-0.64%
jan 1, 2008
4.079
+0.034
0.85%
jan 1, 2009
3.787
-0.292
-7.16%
jan 1, 2010
5.04
+1.254
33.11%
jan 1, 2011
5.223
+0.183
3.62%
jan 1, 2012
5.979
+0.756
14.48%
jan 1, 2013
6.284
+0.304
5.09%
jan 1, 2014
6.8
+0.516
8.21%
jan 1, 2015
7.115
+0.316
4.65%
jan 1, 2016
7.502
+0.387
5.44%
Ranking of countries by current statistics by years


Comments: