29
/
en
AIzaSyAYiBZKx7MnpbEhh9jyipgxe19OcubqV5w
April 1, 2024
165099
Jordan
JOR
true
2
1
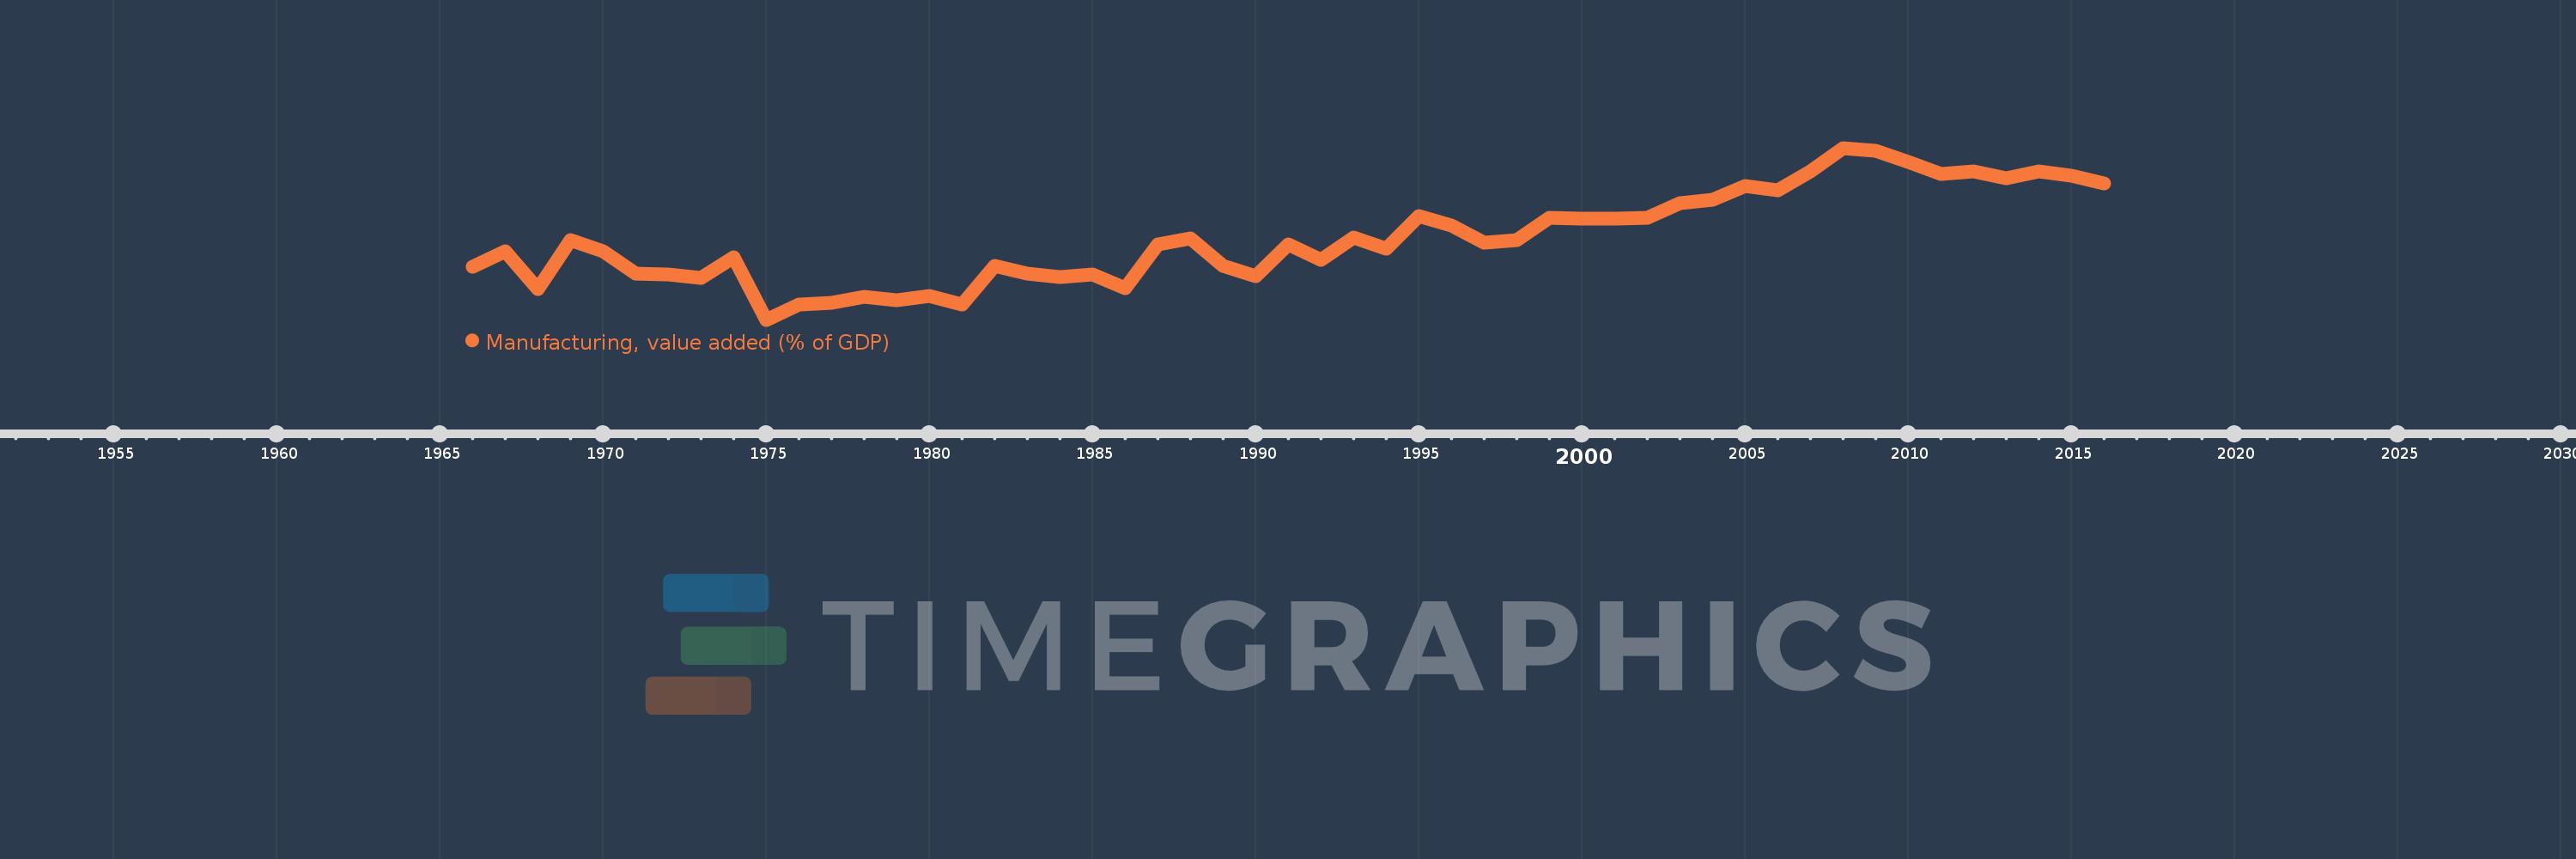
Manufacturing, value added (% of GDP)
2016,2015,2014,2013,2012,2011,2010,2009,2008,2007,2006,2005,2004,2003,2002,2001,2000,1999,1998,1997,1996,1995,1994,1993,1992,1991,1990,1989,1988,1987,1986,1985,1984,1983,1982,1981,1980,1979,1978,1977,1976,1975,1974,1973,1972,1971,1970,1969,1968,1967,1966
This statistics in other country:
AfghanistanAlbaniaAlgeriaAndorraAngolaAntigua and BarbudaArab WorldArgentinaArmeniaArubaAustraliaAustriaAzerbaijanBahamas, TheBahrainBangladeshBarbadosBelarusBelgiumBelizeBeninBermudaBhutanBoliviaBosnia and HerzegovinaBotswanaBrazilBrunei DarussalamBurkina FasoBurundiCabo VerdeCambodiaCameroonCanadaCaribbean small statesCayman IslandsCentral African RepublicCentral Europe and the BalticsChadChileChinaColombiaComorosCongo, Dem. Rep.Congo, Rep.Costa RicaCote d'IvoireCroatiaCubaCyprusCzech RepublicDenmarkDjiboutiDominicaDominican RepublicEarly-demographic dividendEast Asia & PacificEast Asia & Pacific (excluding high income)East Asia & Pacific (IDA & IBRD countries)EcuadorEgypt, Arab Rep.El SalvadorEquatorial GuineaEritreaEstoniaEthiopiaEuro areaEurope & Central AsiaEurope & Central Asia (excluding high income)Europe & Central Asia (IDA & IBRD countries)European UnionFaroe IslandsFijiFinlandFragile and conflict affected situationsFranceGabonGambia, TheGeorgiaGermanyGhanaGreeceGrenadaGuatemalaGuineaGuinea-BissauGuyanaHeavily indebted poor countries (HIPC)High incomeHondurasHong Kong SAR, ChinaHungaryIBRD onlyIcelandIDA & IBRD totalIDA blendIDA onlyIDA totalIndiaIndonesiaIran, Islamic Rep.IrelandItalyJamaicaJapanJordanKazakhstanKenyaKiribatiKorea, Rep.KosovoKuwaitKyrgyz RepublicLao PDRLate-demographic dividendLatin America & Caribbean Latin America & Caribbean (excluding high income)Latin America & the Caribbean (IDA & IBRD countries)LatviaLeast developed countries: UN classificationLebanonLesothoLibyaLithuaniaLow & middle incomeLow incomeLower middle incomeLuxembourgMacao SAR, ChinaMacedonia, FYRMadagascarMalawiMalaysiaMaldivesMaliMaltaMarshall IslandsMauritaniaMauritiusMexicoMicronesia, Fed. Sts.Middle East & North AfricaMiddle East & North Africa (excluding high income)Middle East & North Africa (IDA & IBRD countries)Middle incomeMoldovaMongoliaMontenegroMoroccoMozambiqueMyanmarNamibiaNepalNetherlandsNew CaledoniaNew ZealandNicaraguaNigerNigeriaNorth AmericaNorwayOECD membersOmanOther small statesPacific island small statesPakistanPalauPanamaPapua New GuineaParaguayPeruPhilippinesPolandPortugalPost-demographic dividendPre-demographic dividendPuerto RicoQatarRomaniaRussian FederationRwandaSao Tome and PrincipeSaudi ArabiaSenegalSerbiaSeychellesSierra LeoneSingaporeSlovak RepublicSloveniaSmall statesSolomon IslandsSomaliaSouth AfricaSouth AsiaSouth Asia (IDA & IBRD)SpainSri LankaSt. Kitts and NevisSt. LuciaSt. Vincent and the GrenadinesSub-Saharan Africa Sub-Saharan Africa (excluding high income)Sub-Saharan Africa (IDA & IBRD countries)SudanSurinameSwazilandSwedenSwitzerlandSyrian Arab RepublicTajikistanTanzaniaThailandTimor-LesteTogoTongaTrinidad and TobagoTunisiaTurkeyTurkmenistanTuvaluUgandaUkraineUnited KingdomUnited StatesUpper middle incomeUruguayUzbekistanVanuatuVenezuela, RBVietnamWest Bank and GazaWorldYemen, Rep.ZambiaZimbabwe Timeline:
This timeline shows a graph from 1966 to 2016 of Jordan. No data until 1965. Number of actual observations by date: 51.
Source name:
World Development Indicators
Source organization:
World Bank national accounts data, and OECD National Accounts data files.
Categories, topics:
Economy & Growth
Last updated:
apr 23, 2017
Indicators value changes by year
Maximum:
21.235
jan 1, 2008
At the date of observation
Value
Absolute change
Change from previous value
jan 1, 1966
11.87
+11.87
0.0%
jan 1, 1967
13.119
+1.249
10.52%
jan 1, 1968
10.11
-3.009
-22.94%
jan 1, 1969
13.951
+3.841
38.0%
jan 1, 1970
13.083
-0.868
-6.22%
jan 1, 1971
11.311
-1.772
-13.55%
jan 1, 1972
11.254
-0.056
-0.5%
jan 1, 1973
11.034
-0.22
-1.95%
jan 1, 1974
12.64
+1.606
14.55%
jan 1, 1975
7.712
-4.928
-38.99%
jan 1, 1976
8.896
+1.184
15.35%
jan 1, 1977
9.019
+0.124
1.39%
jan 1, 1978
9.532
+0.513
5.69%
jan 1, 1979
9.224
-0.309
-3.24%
jan 1, 1980
9.599
+0.376
4.07%
jan 1, 1981
8.878
-0.721
-7.52%
jan 1, 1982
11.966
+3.088
34.78%
jan 1, 1983
11.328
-0.638
-5.33%
jan 1, 1984
11.072
-0.256
-2.26%
jan 1, 1985
11.302
+0.23
2.08%
jan 1, 1986
10.182
-1.12
-9.91%
jan 1, 1987
13.649
+3.466
34.04%
jan 1, 1988
14.126
+0.477
3.5%
jan 1, 1989
11.93
-2.195
-15.54%
jan 1, 1990
11.125
-0.806
-6.75%
jan 1, 1991
13.637
+2.512
22.58%
jan 1, 1992
12.436
-1.201
-8.8%
jan 1, 1993
14.207
+1.771
14.24%
jan 1, 1994
13.295
-0.912
-6.42%
jan 1, 1995
15.875
+2.58
19.41%
jan 1, 1996
15.099
-0.776
-4.89%
jan 1, 1997
13.757
-1.342
-8.89%
jan 1, 1998
13.965
+0.208
1.51%
jan 1, 1999
15.719
+1.754
12.56%
jan 1, 2000
15.639
-0.081
-0.51%
jan 1, 2001
15.664
+0.025
0.16%
jan 1, 2002
15.744
+0.08
0.51%
jan 1, 2003
16.885
+1.142
7.25%
jan 1, 2004
17.181
+0.296
1.75%
jan 1, 2005
18.257
+1.077
6.27%
jan 1, 2006
17.911
-0.347
-1.9%
jan 1, 2007
19.383
+1.472
8.22%
jan 1, 2008
21.235
+1.853
9.56%
jan 1, 2009
20.993
-0.243
-1.14%
jan 1, 2010
20.115
-0.877
-4.18%
jan 1, 2011
19.163
-0.952
-4.73%
jan 1, 2012
19.376
+0.213
1.11%
jan 1, 2013
18.828
-0.549
-2.83%
jan 1, 2014
19.419
+0.592
3.14%
jan 1, 2015
19.022
-0.397
-2.04%
jan 1, 2016
18.467
-0.555
-2.92%
Ranking of countries by current statistics by years


Comments: